Population intelligence and outcomes you can defend.
Participants are not case files. They are trajectories. The Participants and Outcomes pillar gives leaders both the individual view and the aggregate view.
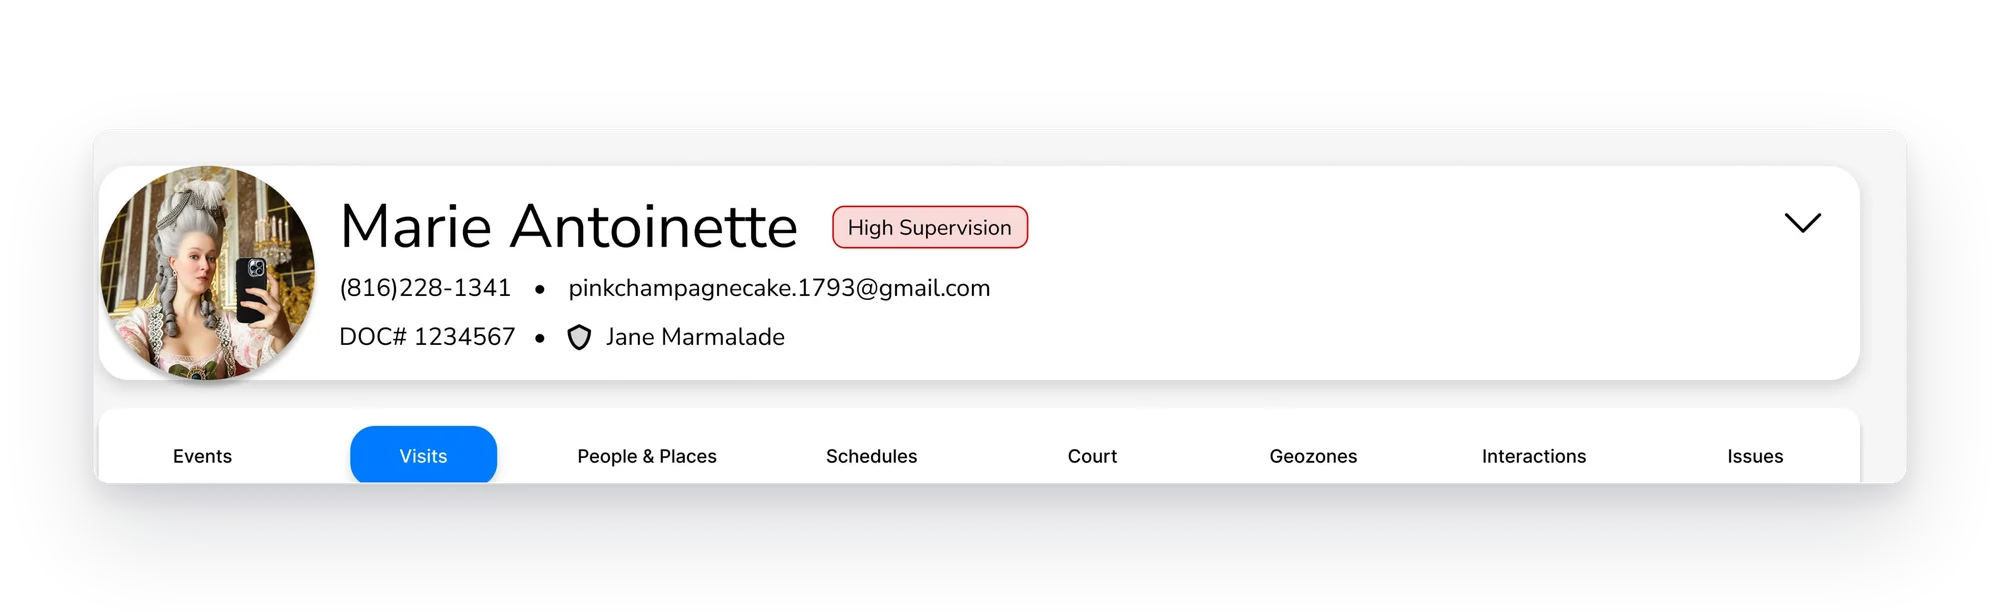
The individual view. Built from every interaction RePath captures.
The trajectory problem.
Agencies see individual cases through their CMS. They see aggregate outcomes through annual reports. What they lack is the middle layer: a population view that shows where each participant is heading, in time to act.
Failures show up too late. A revocation. A missed court date. A new charge. The trajectory was visible months before the failure happened. The signals were in the data. The agency had no way to see them.
Leading indicators.
The signals that separate trajectories long before outcomes confirm them.
Employment patterns. Treatment compliance and attendance. Check-in engagement. GPS behavior. Reinforcement received from officers. Skill execution observed during visits. Risk and need assessment updates. Each one a signal. Combined, they form a trajectory: success, improving, stable, declining.
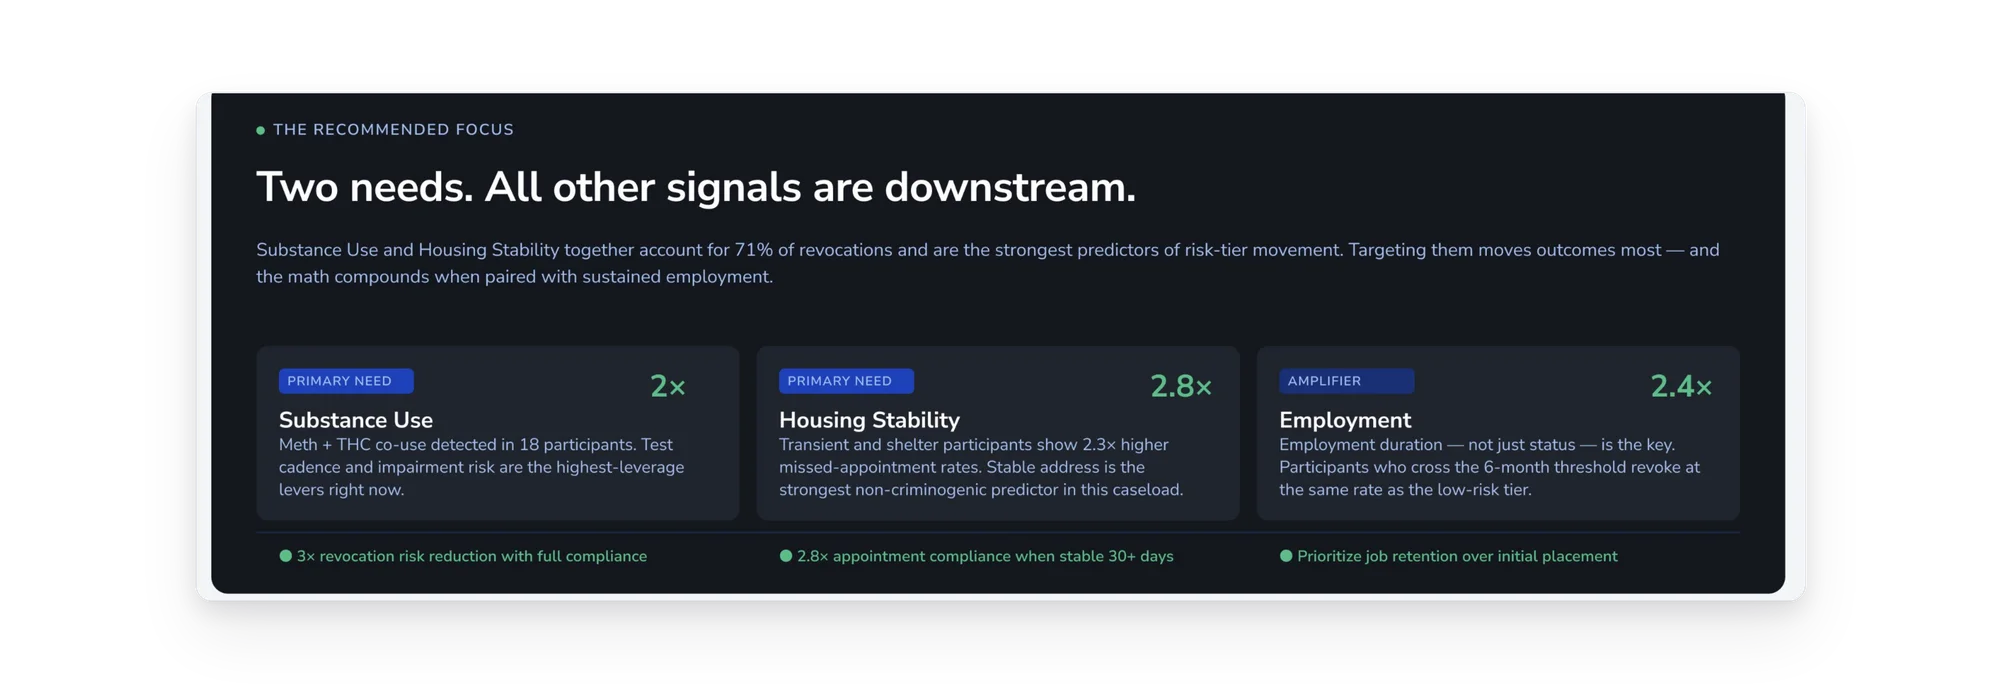
Risk alerts. Intervention before failure.
When a trajectory declines, the officer gets a flag. Not a generic warning. A specific signal: engagement dropped, employment lost, three missed contacts, a sudden change in GPS pattern. With each flag, a recommended intervention drawn from what has worked for similar participants.
Officers stop reacting to outcomes. They start acting on signals.
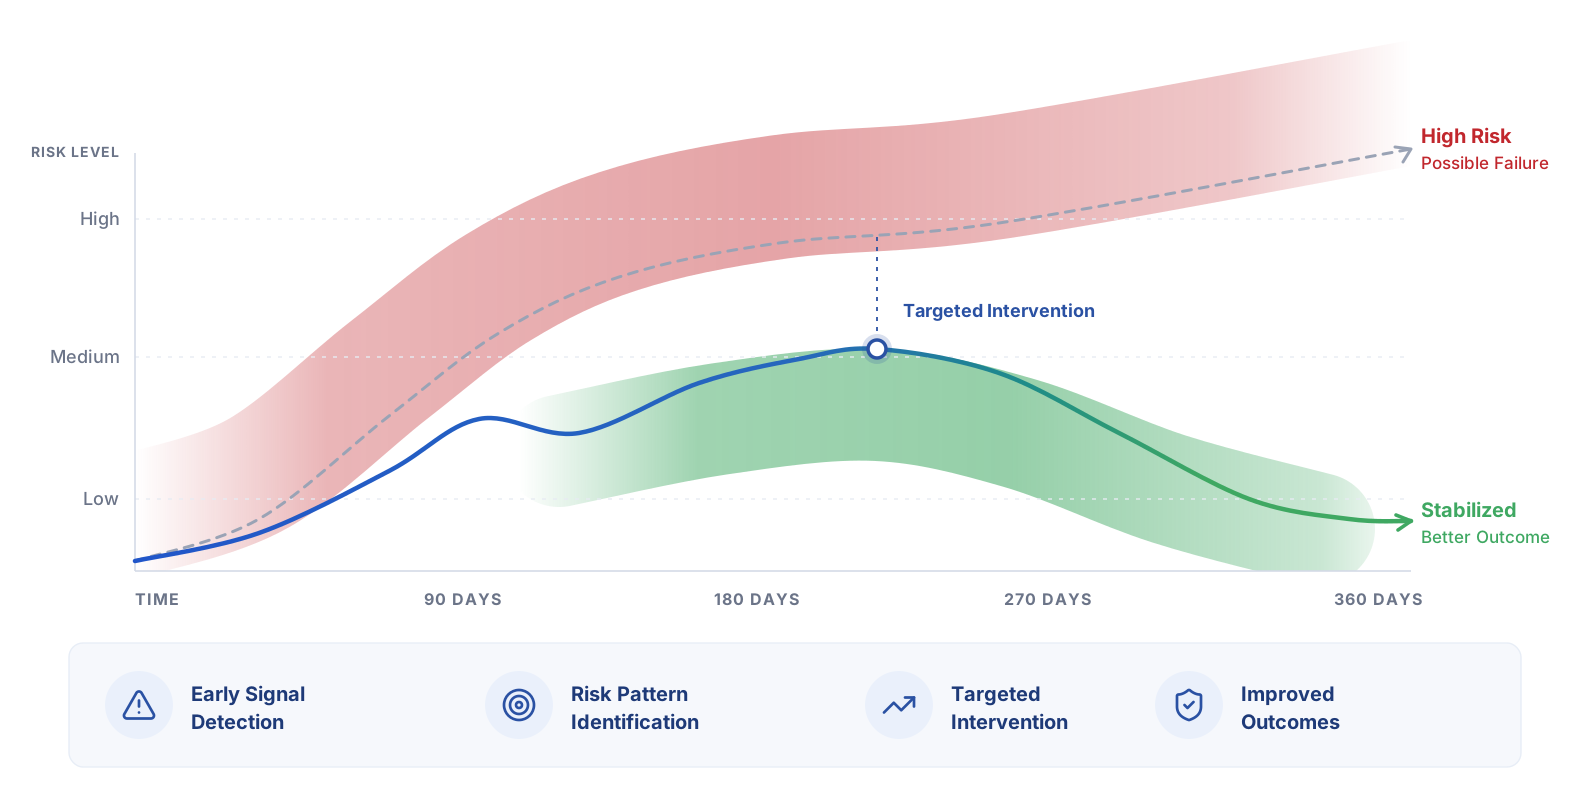
Intervention effectiveness, by population.
Roadmap preview. Not running on live agency outcomes today.
The platform is designed to answer what works for which population. Cognitive behavioral programming plus employment support compared against either alone. Contact frequency with or without skill-building. The intent is to give agencies a defensible read on which investments move the needle and which do not.
Program reviews become evidence-based. Grant reports cite intervention effectiveness, not pilot anecdote. Budget conversations have ground to stand on. We are building this with design partners now; it is not running on production agency data yet.
The outcomes commitment.
The platform is built to link supervision quality to the outcomes the agency is accountable for: revocation, recidivism, completion, time to failure. That linkage is the hypothesis the design partner program is built to prove, on partner data.
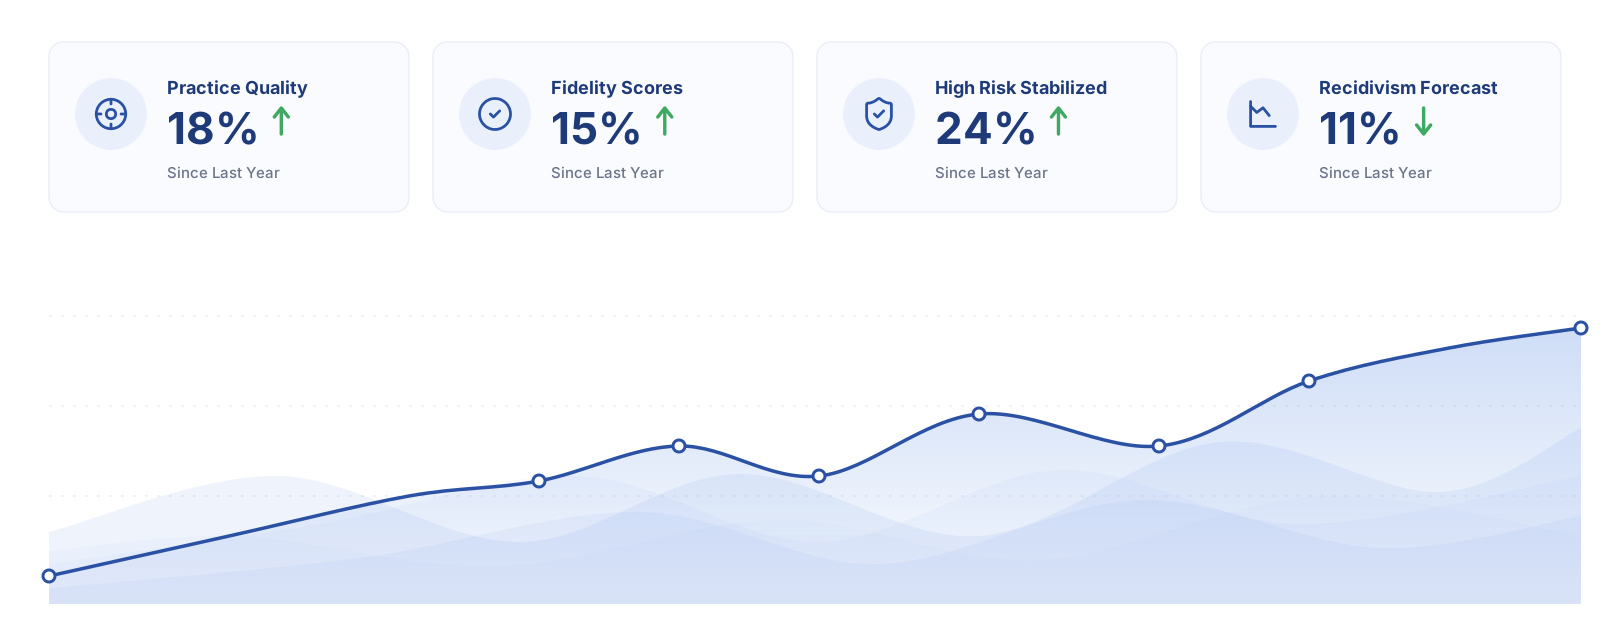
Modeled targets from the scoring methodology. Not live results. Real numbers land as design partner deployments mature.
In juvenile supervision, every resource and every data point ultimately connects back to one question: whether kids re-offend.
Explore the other pillars.
Three connected layers. One operating view.
Supervision Practice
The quality of the work being done. Evidence-based fidelity scored at every contact.
Explore the pillar →Officer Performance
How individual officers are doing. Coaching needs. Caseload performance. Trajectory.
Explore the pillar →Participants & Outcomes
You are here. Who is being supervised, what is happening to them, where outcomes are moving.
“RePath gives us a tool to step in faster because we can see what is going on with them. The tracking and check in pieces help us intervene quicker… When we get a message that someone missed a check in, we will reach out that moment to check in on the person. It lets that person know that someone really cares and is on their team for recovery.”
Become an Intelligence design partner.
Shape the product. Get it first. Lock in the rate. Design partners get early access to RePath Intelligence, direct influence on the V1 roadmap, and anchor pricing that holds through general availability. Limited to a small number of agencies.