Plain-language summary
The short version
The question. Can a frontier AI model grade recorded supervision visits against a 43-item, standards-based rubric as reliably as expert human auditors?
What we did. Three experienced auditors independently scored 30 de-identified recorded visits from multiple agencies (adult, juvenile and treatment court). An AI grader (Claude Sonnet 5 running a calibrated prompt, three independent runs averaged) scored the same visits. Every total was recomputed from item-level marks; no grader, human or AI, was trusted to do its own arithmetic.
What we found.
- The experts disagreed more than most people expect: two auditors’ scores for the same visit landed 19.0 to 33.3 points apart on average, depending on the pair.
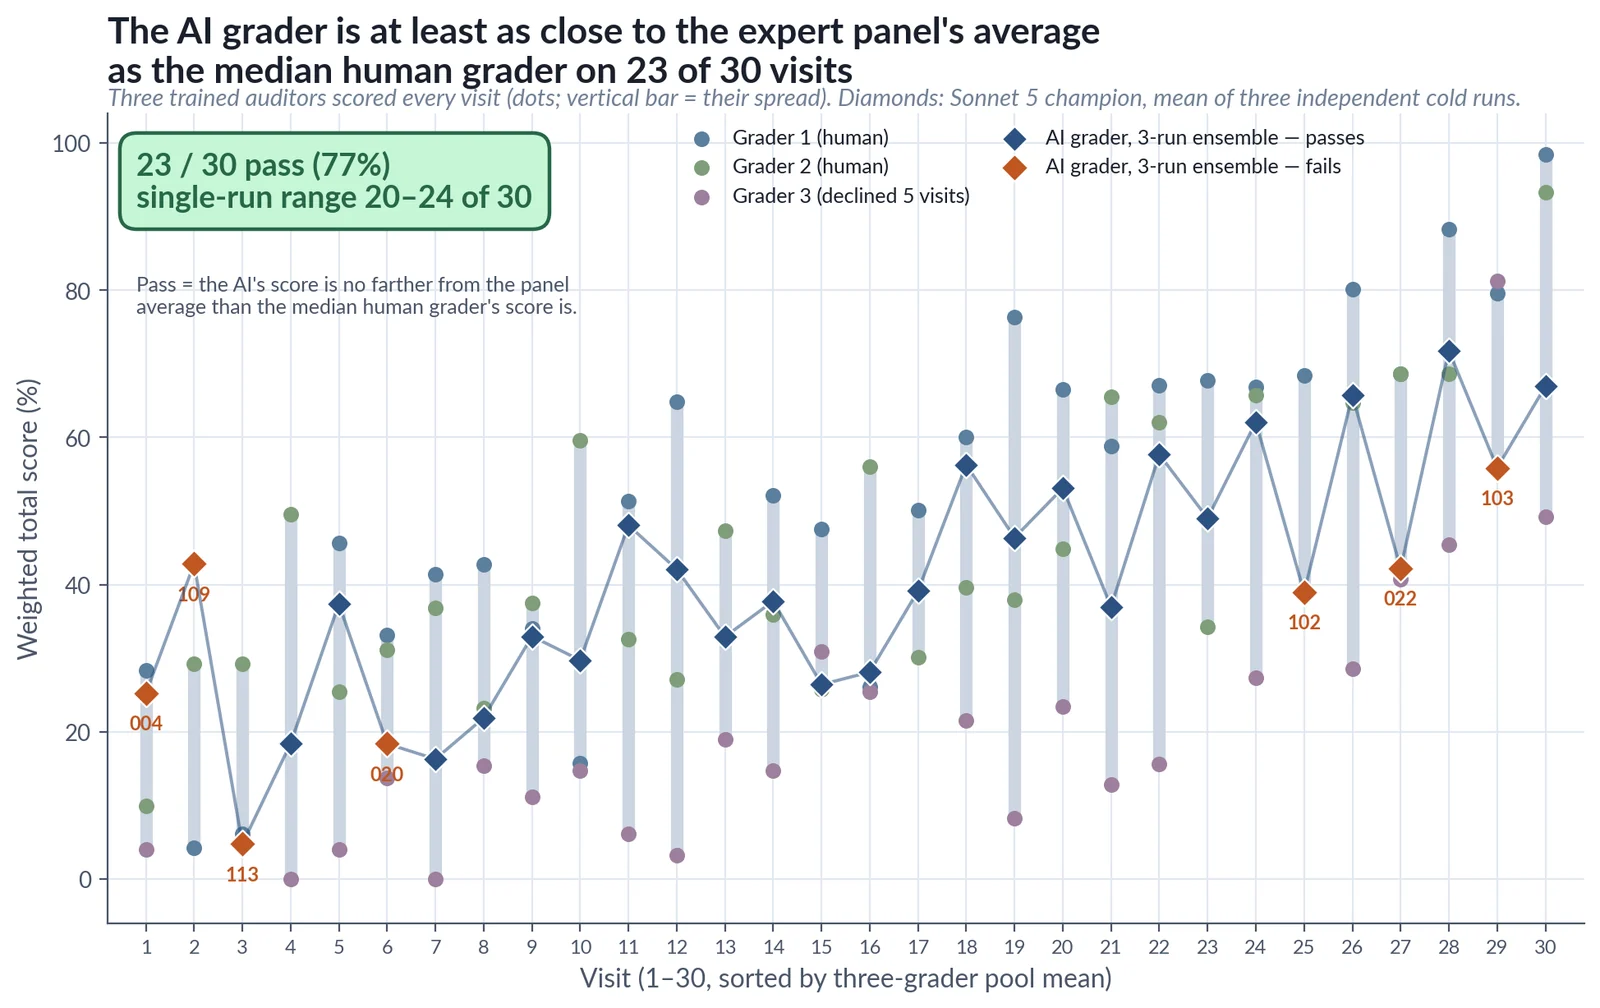
- The AI was at least as close to the three-expert average as the median expert on 23 of 30 visits (77%), including 16 of 18 visits never used to tune the final prompt.
- The AI sat closer to each auditor than the auditors sat to one another, and adding it to the panel raised the panel’s agreement statistic (Krippendorff’s α from +0.199 to +0.333).
- Prompt and model are a pair: a grading prompt tuned on one model version lost accuracy on another, so every model version must be re-validated before use.
Why it matters. A validated AI grader can extend quality review from a handful of visits per officer per year to most or all recorded visits, turning evaluation from a staged sample into a census of real work, for coaching.
Limits. Thirty visits; Treatment Court visits passed 6 of 10; demographic subgroup analysis deferred; no participant outcomes measured. Not for hiring, discipline or any other personnel decision.
Full text
Version 1.0, July 2026. Plain-text rendering of the paper for reading and search. Figures and tables are reproduced from the PDF; if anything here differs from the PDF, the PDF is the version of record.
Working paper (RePath Labs). Not peer-reviewed. This is a preprint made available for timely dissemination and comment. It has not undergone journal peer review; findings and framing may be revised in later versions.
Suggested citation: Green, T., Warren, M., & Meade, V. (2026). Validating an AI Grader for Community Corrections Supervision Visits: A reliability and agreement study against expert human auditors. RePath Labs working paper. DOI: 10.31219/osf.io/9wq32_v1
Correspondence: Ted Green, RePath Labs (tedgreen@ehawksolutions.com).
License: © 2026 RePath Labs. All rights reserved.
Materials availability. The rubric structure, the human and model scores, the analysis scripts, and model-version details are described in Appendix E; the full verification package may be made available to interested parties by agreement. The proprietary grader prompt (Appendix C) and the PII-bearing visit transcripts are not distributed.
Scope. This tool is intended for officer coaching and outcome improvement. It is not intended for hiring, firing, promotion, discipline, or any other personnel decision.
Abstract
Meta-analytic evidence links sustained officer fidelity to core correctional practices with substantially lower participant recidivism; caseloads supervised by untrained officers recidivate roughly 39% more often than those supervised by trained officers (Chadwick et al., 2015). That fidelity, however, can be measured today only by having trained humans hand-code recordings, which does not scale beyond a small audit sample. We test whether a frontier large language model can grade recorded supervision visits against a rubric of observable, standards-based officer behaviors as reliably as expert human auditors. On a 30-visit corpus drawn from multiple agencies and independently scored by three expert graders, we report a descriptive validation of an LLM grader (Claude Sonnet 5 running a calibrated prompt, scored as a three-run ensemble). The expert graders agree only moderately with one another (item-level agreement 65–73%, Gwet’s AC1 +0.34 to +0.46; weighted-total Krippendorff’s α +0.199), a level typical of subjective behavioral coding. Against this panel, the model lands at least as close to the panel average as the median human grader on 23 of 30 visits (77%, 95% CI 0.60–0.90; single-run range 20–24 of 30; 16 of 18 on the never-seen holdout). It agrees with the panel at the item level about as well as the graders agree with each other (macro-F1 0.57–0.74), sits closer to each grader than the graders sit to one another, and, consistent with sitting near the panel’s center, raises the panel’s agreement statistic when added as a member. Grader-prompt performance is tied to the specific model version. We scope the tool to officer coaching, not personnel decisions or participant outcomes, and discuss deployment, reliability, cost, and limitations, along with next steps: an adjudication study to establish a consensus reference, and a study of whether the model can coach as well as a human.
1. Executive summary
Why this study matters. The best evidence in community corrections says that what happens inside a supervision visit is the strongest lever an agency has on participant outcomes. The Labrecque, Viglione, and Caudy (2022) meta-analysis of 25 officer-training studies found that officers who deliver core correctional practices with fidelity reduce violations and rearrests, while officers who drift produce outcomes no better than untrained peers (§3.1). Chadwick et al. (2015) sizes that lever: untrained-officer caseloads recidivate about 39% more often than trained ones (roughly 50% versus 36%). The field has known this for years. What it has never had is a way to measure visit quality at scale. Every study behind that finding relied on trained humans hand-coding recordings, which no agency can afford beyond a sliver of its visits.
This paper takes a first step toward validating the missing instrument. On a 30-visit corpus independently scored by three expert auditors, an AI grader agreed with the expert panel about as closely as the auditors agreed with one another, and by several measures it sat nearer the center of the panel than any single auditor did. If the literature is right that visit quality drives participant success, a practical way to measure that quality on every visit would be a meaningful capability for the field.
It also changes what evaluation can be. In most audit programs we have observed, quality review means one recorded visit per officer per quarter or year. The officer knows which visit is being evaluated when the rest are not, so that visit is closer to a performance than to normal practice, and a single visit may bear no relation to the officer’s average (§3.2). A validated AI grader makes every routine visit gradable: a census of real visits instead of a staged sample the officer hand-picks, feeding coaching with trend lines built on real-world work (§3.2, §6.3).
The question. Can a frontier large language model grade recorded community corrections officer visits against published national-standards criteria as well as expert human auditors do, well enough to serve as a routine-scoring tool for officer coaching feedback?
The short answer. Yes, on this corpus. The comparison is stronger than it first appears, because the trained humans agree with each other less than a casual reader would assume. Three expert auditors (Valerie Meade, Maureen Flanagan, Katie Myers) independently scored the same 30 visits. Their agreement is modest. Two graders’ scores for the same visit differ by an average of 19.0 to 33.3 percentage points on the weighted total, depending on the pair. Krippendorff’s α, a standard agreement statistic on which a value of one means perfect agreement and zero means no better than chance, is +0.462 on the weighted total for the two closer graders and +0.199 for the three-grader panel. Against this panel, the headline LLM grader (Claude Sonnet 5 running a calibrated rubric prompt, §4.7, scored as the average of three independent cold runs and called the S5 champion throughout) lands at least as close to the panel average as the median human grader on 23 of 30 visits (77%; single-run range 20–24 of 30, i.e. 67–80%; 16 of 18 on the never-seen holdout), sits closer to each individual human grader than that grader’s human colleagues do, and, consistent with its central position in the panel, raises the panel’s Krippendorff α when added as an additional rater (from +0.199 to +0.333).
The numbers worth remembering.
- Expert human–human agreement (the comparator we measured against). Pairwise mean absolute Δ on weighted total (Δ is the gap between two graders’ scores for the same visit): the closest pair 19.0 pp (95% CI 14.9–23.1), and the two pairs involving the strictest grader 33.3 pp (26.2–40.2) and 28.4 pp (23.3–33.4). Krippendorff’s α on weighted total: +0.462 (CI 0.11–0.67) with two raters, dropping to +0.199 (CI −0.06 to +0.37) with three. The drop is real, not noise: one grader scored on a systematically stricter scale than the other two, while still rank-ordering visits consistently with them (r +0.59, +0.57, at least as high as the other pair’s +0.51). All three are experienced auditors, and we treat none of them as ground truth; this is the variability the field expects on a demanding instrument. While two graders scored all 30 visits, the third declined to score 5 of 30, with documented reasons, which is itself a real-world QA finding about grader behavior, not the tool’s output (§4.4, §5.2).
- LLM–human agreement. On each visit we ask whether the LLM lands at least as close to the panel average as the median human grader does; we call this test Formulation B. In plain terms, the AI passes a visit if its score is no farther from the three-grader mean than the median individual grader’s score is. The S5 champion three-run ensemble passes on 23 of 30 visits (77%, 95% CI 0.60–0.90; single-run range 20–24/30), with mean absolute Δ vs the pool of 9.2 pp, Pearson r +0.778 (CI 0.63– 0.88), and AUC 0.902 (CI 0.73–0.99) at the pool-median threshold. (Pearson r asks whether two scorers rank and space the visits the same way; AUC asks how reliably the tool separates stronger visits from weaker ones. For both, a value of one is perfect, and for AUC one-half is a coin flip.) The prior baseline (Sonnet 4.5 + B-iter19 ensemble) scores 24/30 (80%) with mean Δ 9.5 pp, r +0.733, AUC 0.856. The LLM ensemble’s distance to each individual grader (14.9, 13.0, and 23.0 pp to the three graders individually) is smaller than either of that grader’s distances to her human colleagues (pairwise human distances 19.0 / 28.4 / 33.3 pp). The model underperforms on one subgroup: Treatment Court visits pass 6/10 (60%) against the pooled 77%, and are first in line for human spot-check in deployment (§5.6). A simpler bounded-agreement check saturates at 30/30 under the wide three-grader band and is not informative (§4.6).
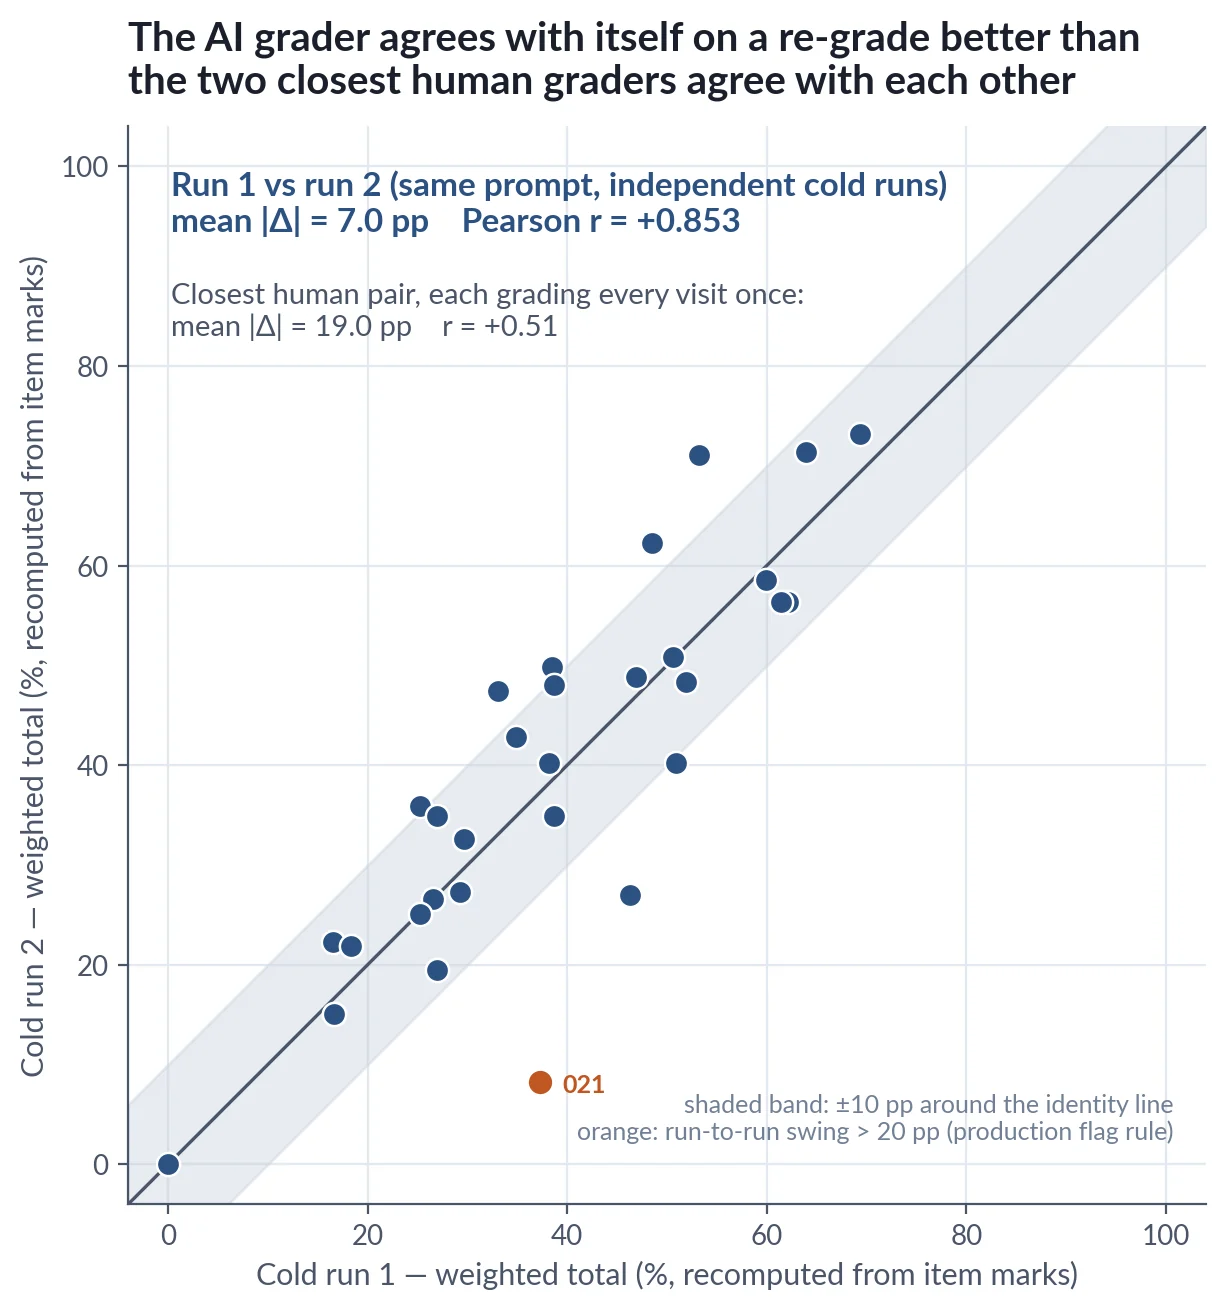
- LLM self-consistency. Asked to grade the same 30 visits three separate times with no memory between runs, the S5 champion agreed with itself more closely than any two humans agreed with each other: run-to-run mean absolute Δ of 7.0–7.7 pp (Pearson r +0.853 between runs 1 and 2), versus 9.0 pp run-to-run for the Sonnet 4.5 baseline and 19.0 pp for the closest human pair. This is not a like-for-like comparison: no human re-graded her own visits, so the human figure is first-grade inter-rater agreement, not intra-rater consistency; a human test-retest study is planned (§8).
- Nobody’s arithmetic is trusted, human or model. Stated subtotals disagreed with recompute-from-item-marks values for all three graders (on 4, 7, and 17 of 30 visits); the LLM’s own stated weighted totals also drift from its item-level marks, by up to 13.3 pp. Every number in this paper is therefore recomputed mechanically from item-level Yes/No/NA marks: the pipeline does the arithmetic deterministically, and no grader, human or model, is trusted to do its own math (§5.7).
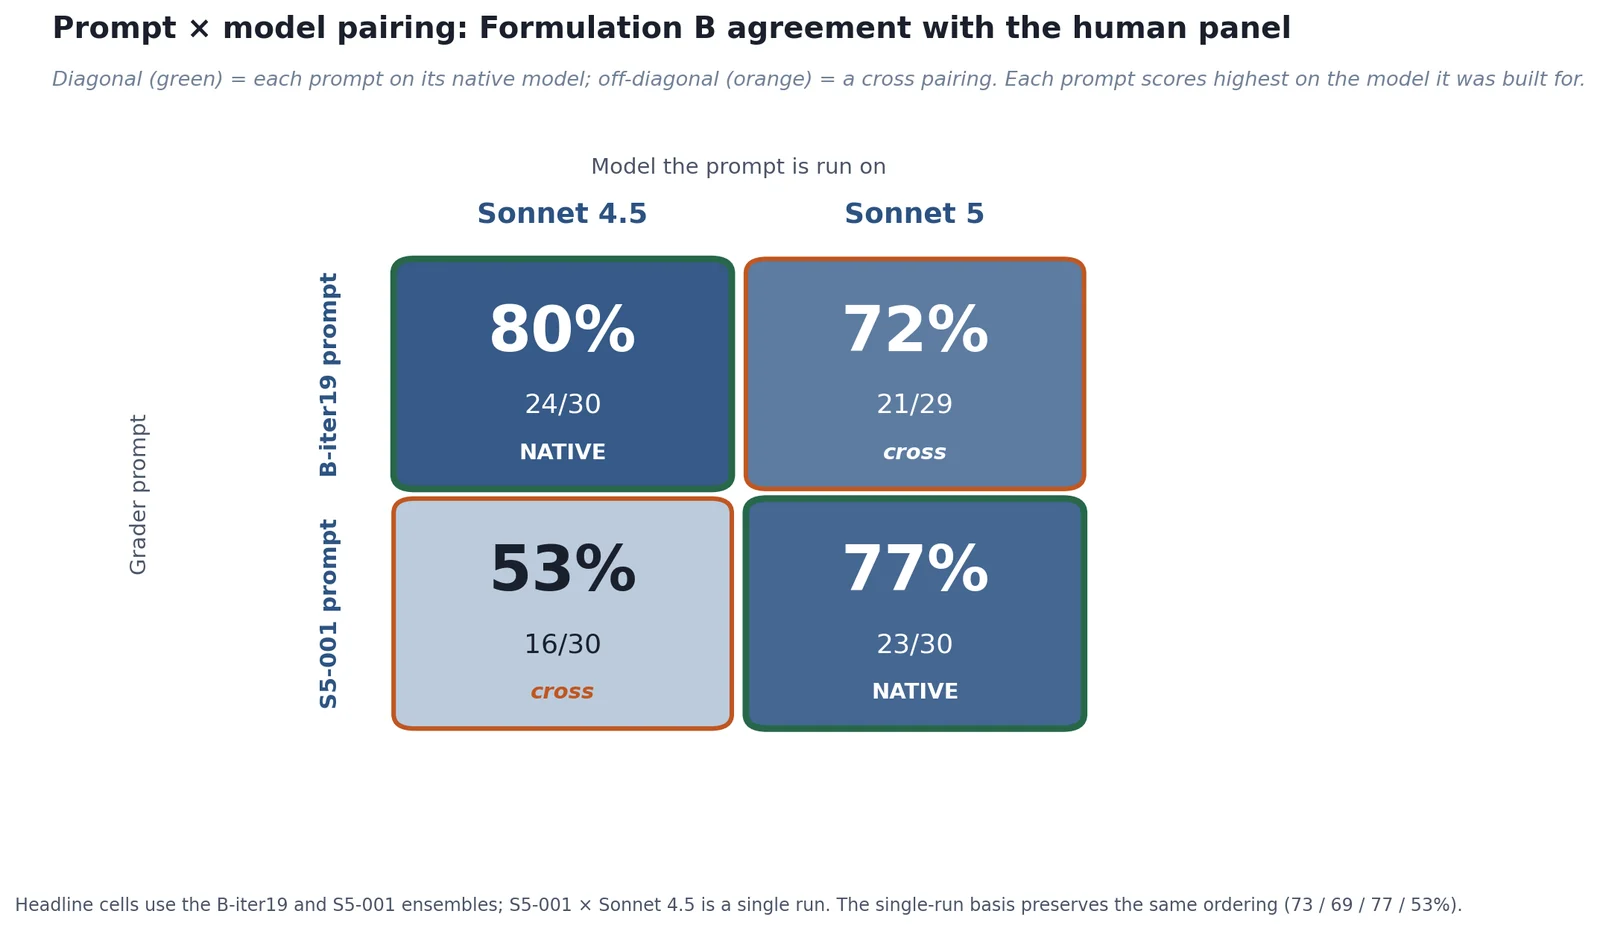
- Prompt–model pairing matters, and portability across model versions cannot be assumed. A grading prompt tuned for one model version does not automatically work on the next, in either direction. The completed prompt×model matrix is diagonal-dominant: each champion prompt performs best on the model it was calibrated for. The Sonnet-4.5-tuned prompt (B-iter19) run verbatim on Sonnet 5 slips to 21/29 (72%) from 24/30 (80%) on its native model; the Sonnet-5 champion run back on Sonnet 4.5 falls further, to 16/30 (53%). The penalty is asymmetric (on the reported ensembles, roughly 8 points one way, 24 the other; on a single-run basis it is roughly 4 and 24, §4.7), so how far an unadapted prompt will drift on a new model cannot be read off how incremental the upgrade looks. A short, guard-railed re-adaptation loop (three iterations, one accepted patch, cold-validated on three fresh 30-visit runs) produced the S5 champion. The operational rule that follows: re-adapt the prompt and re-validate it against the human panel for every model version put into service (§4.7, §6.3).
- Cross-vendor: nothing matches the champion on its home model. A July 2026 six-model sweep ran the champion prompt verbatim (temperature 0, one run per model, totals recomputed, three-grader pool). The best cross-vendor results trail the champion on every headline metric: Formulation B 70% (MiniMax M3) vs 77%; AUC 0.882 (GLM-5.2) vs 0.902; r +0.740 (DeepSeek V4 Flash) vs +0.778. This is consistent with prompt–model pairing mattering more than vendor tier on this corpus. GPT-5.5’s content-moderation refusal rate on this corpus moved from ~28% (June, prior prompt) to 3% (July) with one reproducible residual refusal. Vendor moderation drift is a governance risk in both directions. Full table and coverage audit in §5.5.
What this is for. Coaching officers on observable behaviors during supervision visits, against a rubric anchored in published national standards (Core Correctional Practices, the APPA National Standards for Community Corrections, and the Risk-Need-Responsivity literature), helps an agency expand audit coverage from a handful of visits per officer per year to most or all of them.
What this is not for: Hiring, firing, promotion, discipline, or any other personnel decision. The validation does not authorize that use, and the limitations (30-visit corpus, demographic analysis deferred, operational-parity rather than outcome-linked scope) are explicit reasons such use would be premature.
How to read this paper. Sections 1, 3, 6, and 9 are written for non-technical readers: what we found, why it matters, and what an agency should do about it. Sections 4 and 5 and the appendices carry the methods, statistics, and full disclosures for technical reviewers. Each statistic gets a plain-language explanation the first time it appears, so a non-technical reader who wants the detail can follow it.
2. Scope and intended use
Intended use. This validation supports the use of an AI grading tool to score recorded community corrections supervision visits against an explicit, standardized rubric of observable officer behaviors, applied uniformly across all visits and derived from published national standards. The intended consumers of these scores are:
- Coaching supervisors, who use scores plus rationale to identify behaviors an officer is doing well and behaviors to develop.
- Officers themselves, for self-review against the rubric.
- Agency QA teams, for triage: surfacing visits that warrant closer human review and guiding remediation efforts.
- Aggregate dashboards at agency level, for tracking practice fidelity to evidence-based standards over time.
The reliable unit is the visit, not the single item. Individual item marks are less reliable than the visit weighted total (§5.2, §6.1), so the reliable signal sits at the visit and trend level. The data therefore does not favor reading item-specific behavioral feedback from a single item mark in isolation; item marks are best used as evidence-linked rationale for the visit score, to be confirmed against the cited transcript spans, rather than as standalone verdicts on individual behaviors.
Out-of-scope use. The scores produced by this tool are not intended for and should not be used for:
- Hiring decisions
- Firing decisions
- Promotion or merit-pay decisions
- Disciplinary action
- Any other personnel decision
Why the distinction matters. Personnel decisions trigger employment-law considerations (Title VII disparate-impact analysis, state-level AI-in-hiring rules) that this validation is not scoped to address. The validation produces measurements; it does not establish that those measurements are appropriate for adverse actions affecting officer livelihoods. An agency wishing to use scores in personnel-adjacent contexts would need a follow-on study covering demographic subgroup analysis, properly-consented officer self-identification, and an explicit disparate-impact assessment. Nothing here limits an agency’s ability to review any visit directly through its full transcript to inform its own decisions; what this validation does not support is treating the model’s numeric score, on its own, as the basis for a personnel decision.
3. Background
3.1 Why supervision‐visit audit matters
Labrecque, Viglione, and Caudy (2022) is the study this project leans on. Their meta-analysis of 25 studies of community-supervision officer training programs (EPICS, STICS, STARR, PCS) found that officer fidelity to the trained practices is the critical moderator of recidivism outcomes, and the authors’ own recommendation points to the missing capability: they call for developing “strategies to monitor and increase fidelity after training.” Trained officers who maintain their skills reduce technical violations and rearrests, while those who drift back to old habits produce no better outcomes than untrained officers. The same meta-analysis found the gap between high- and low-fidelity officers to be larger than the gap between trained and untrained officers: the point-estimate differences in recidivism ran more than three times greater for rearrests and nearly two times greater for reconvictions, though on a small number of studies these fidelity comparisons did not reach statistical significance. The leverage, in other words, is in sustaining fidelity over time, not in delivering the initial training alone. And across that literature, fidelity is measured the same labor-intensive way: trained human coders reviewing recorded or directly observed officer contacts and scoring them by hand against a structured rubric, a process that cannot scale beyond research settings.
That is the gap a validated LLM grader fills: it replicates at scale what Labrecque’s research teams did manually, scoring each officer contact for session structuring (the dimension with the largest effect at r = .511), relationship skills (r = .419), cognitive techniques (r = .418), and behavioral practices (r = .309). These are four dimensions that map directly onto Tiers 2 and 3 of the rubric this study grades against (Section 4.3). The meta-analysis also found that trained officers shift discussion content toward criminogenic needs and away from administrative topics, another pattern an LLM grader can detect at scale.
The practical implication: leadership gets a continuous fidelity dashboard rather than a one-time research audit, and officers get coaching feedback tied to the practice dimensions the literature says matter most for reducing recidivism. The Chadwick et al. (2015) meta-analysis sizes the stakes: trained-officer caseloads recidivate at about 36% versus about 50% for untrained (meta-analytic averages 36.2% and 49.9%; odds ratio 1.48), a roughly 13-point absolute gap and about 39% higher recidivism for untrained-officer caseloads in relative terms, and every study that described its training procedure reported using booster sessions to sustain the effect (6 of the 10). Continuous automated scoring is, in effect, a permanent booster session.
The items the rubric scores are drawn from the APPA standards and Core Correctional Practices, codified into three tiers and 43 items (Section 4.3). The broader training literature these standards codify, including STICS (Bonta et al., 2021), EPICS (Lowenkamp et al., 2013), and the Motivational Interviewing Treatment Integrity system (Moyers et al., 2016), informs that practice base.
Portela et al. (2024) provide independent support from an adjacent domain. In a 609-participant study comparing human predictions of violent recidivism with and without algorithmic risk-assessment support, algorithmic assistance improved the accuracy of participants’ predictions, and professional participants reported that they would not adopt a fully automated system but valued the tool to standardize and double-check their own judgments. The pattern generalizes to visit grading: the AI scores, humans coach against the scores and retain override authority.
3.2 The current‐audit bottleneck
A typical community corrections agency audits a small fraction of recorded visits (often single-digit percentages), because a trained QA auditor can carefully score perhaps four to eight visits per working day. At an average of over 100 recorded visits per officer per quarter and dozens to hundreds of officers per agency (these visit-volume and throughput figures reflect RePath’s operational experience rather than a published source), exhaustive audit is operationally infeasible, and the audit fraction caps how much coaching feedback an officer ever receives.
The sampled visit is also not a normal visit. In most audit programs we have observed, quality review means one visit per officer per quarter, sometimes per year, and the officer knows which visit is being recorded for evaluation when the rest are not. Often the officer also controls which recording is submitted: they can record several, listen back, and hand in the one that scores best, or re-record until satisfied. So the evaluated visit is a performance: the officer prepares for it, cherry-picks it, and the score captures their best behavior, not their ordinary practice. Even setting the observer effect aside, one visit is a sample of one. Judging an officer’s practice from a single evaluated visit a year is like judging a baseball player from one at-bat a year, and letting the player choose which at-bat counts: the at-bat is real, but it says almost nothing about the season.
A tool that scores every recorded visit resolves both problems at once. Evaluation stops being an event the officer stages for and becomes a property of ordinary work: a census of real visits instead of a staged sample. Single data points become trend lines, feedback arrives continuously instead of once a quarter, and improvement gets measured on the visits that actually happen. The unit economics of supervision coaching shift from “occasional research-grade sampling” to “continuous, low-stakes feedback at the scale of the recording corpus,” feedback that goes to coaching conversations, not personnel files (§2).
3.3 Why an LLM grader is plausible now
Recent (2024–2026) frontier-model work in adjacent behavioral domains points the same way. Most directly, Dunivin (2025), on LLM-based qualitative coding with codebooks, finds that current frontier models match or approach human inter-rater reliability when the rubric is explicit and the evidence span is contained in a written transcript. Related work on motivational interviewing, an adjacent standards-based behavioral framework, benchmarks frontier models against the Motivational Interviewing Treatment Integrity (MITI) rubric and finds them at fair-to-good competence relative to human therapists (Hu et al., 2025). Community corrections visit grading sits squarely in this problem class.
3.4 What this study answers
Four empirical questions:
1. LLM self-consistency. Does the LLM grade the same transcript the same way on repeated independent cold runs of the same prompt? 2. Agreement with an expert panel. Do three trained expert auditors agree with each other on this rubric, within what bounds, and does the LLM agree with that panel at least as well as its members agree with each other? 3. Portability. Does the approach carry across model versions and vendors, and what does it take to move it? 4. Recalibration. When the underlying model is upgraded, does the documented calibration procedure restore agreement, or does the validation have to start over?
This is a descriptive validation study: we report the analysis choices where they are used (Section 4.6) rather than as formal hypotheses. A simpler bounded-agreement check proves uninformative because it saturates across the three-grader panel, so the agreement measure we report is Formulation B; the simpler check is still noted wherever it applies.
4. Methods
4.1 Corpus
The validation corpus comprises 30 PII-redacted transcripts of recorded supervision visits drawn from multiple community corrections agencies, from a larger archive available for future expansion. The unit graded throughout is the transcript of a recorded visit. Visit length in the 30-visit corpus ranges from approximately 11 to 77 minutes (median ~25 minutes). The corpus is stratified to span three case-type categories: Adult (10 visits), Juvenile (10 visits), and Treatment Court (10 visits). It also spans three supervision-level buckets: High (15 visits), Low (12 visits), and Medium (3 visits). Each transcript carries operational metadata (supervision level, minutes, case type); no officer or participant demographic identifiers are included. The 30 visits were selected to populate the case-type and supervision-level strata described above, not on the basis of any model result, so corpus composition could not have been tuned to model performance.
(Corpus composition: 10 Adult, 10 Juvenile, 10 Treatment Court; 15 HIGH, 12 LOW, 3 MEDIUM supervision; median ~25 min.)
4.2 Corpus split
For this v1 paper, all 30 graded transcripts function as the validation set. Additional transcripts from the broader archive are reserved for future work (Section 8). The 30-visit set is small for a held-out paradigm; we therefore report it as a validation set rather than a held-out test set, and treat the agreement tests in Section 4.6 as the appropriate evaluation at this scope.
4.3 Rubric
The Supervision Quality Fidelity Rubric 2.0 was authored from published national standards rather than from any single agency’s audit manual. Source documents: the American Probation and Parole Association’s National Standards for Community Corrections (APPA, n.d.), Core Correctional Practices (CCP), and the Risk-Need-Responsivity literature.
The rubric has three tiers and 43 binary items (Yes / No / NA), with tier scores computed as Yes ÷ (Yes + No) and weighted into a total score as T1 × 0.20 + T2 × 0.30 + T3 × 0.50.
- Tier 1: Foundations (5 items, 20% weight). Whether the visit had a stated purpose, whether case-plan goals were referenced and collaboratively discussed, whether conditions were reviewed, and whether the next appointment was confirmed.
- Tier 2: Structure (7 items, 30% weight). Rapport building, review of previous goals, intervention delivered, next steps assigned, criminogenic need addressed, reinforcement ratio 4:1 or better, motivational-interviewing adherence.
- Tier 3: Core Correctional Practice Execution (31 sub-items across 9 skill categories, 50% weight). Effective Use of Authority; Modeling Prosocial Behavior; Effective Reinforcement; Effective Disapproval; Problem Solving; Role Clarification; Cognitive Restructuring; Active Listening; Giving Feedback. Each skill category is decomposed into 3–4 observable sub-behaviors. The Tier 3 weighting carries the most signal precisely because it captures the CCP dimensions Labrecque et al. (2022) identified as the strongest predictors of officer-fidelity-to-recidivism outcomes.
The rubric (instrument edition “2.0”) was content-hashed and frozen as the study artifact “v1.0” in May 2026; “2.0” denotes the instrument’s development edition and “v1.0” the specific frozen version validated here. Every measurement in this paper was computed against frozen rubric v1.0.
The full rubric, including item text and scoring rules, is reproduced in Appendix A.
4.4 Graders
Three expert human graders independently scored all 30 transcripts in the validation set:
- Valerie Meade. Deputy Director at the Crime and Justice Institute (CJI), with nearly three decades in adult and youth justice across community and institutional settings and expertise in cognitive-behavioral interventions, motivational interviewing, model fidelity, and continuous quality improvement. She previously led the fidelity team at the Johnson County (KS) Department of Corrections, running county-wide fidelity checks across corrections and community corrections and coaching staff on evidence-based practices; that work gave her hands-on experience in transcript-based scoring, one-on-one coaching, and rubric design. Through her work at CJI, she has also trained fidelity coaches in several states.
- Maureen Flanagan. A juvenile probation supervisor for the State of Connecticut for most of her career, trained in motivational interviewing more than 20 years ago, where she routinely reviewed recordings of her officers’ work, scored their performance, and coached to it. She helped roll out Forensic CBT in Connecticut, building its policy framework, fidelity implementation, and scoring methodology (including the process for evaluating raters themselves), and later trained probation and corrections officers across multiple agencies on Core Correctional Practices at the Crime and Justice Institute; an earlier post as a probation officer in England adds a cross-system comparative view.
- Katie Myers. Co-owner and founder of Quality Solutions Consultants, a national evidence-based-practices consultancy, and Team Leader of the Evidence-Based Principles Unit at the Johnson County (KS) Department of Corrections. With more than 30 years in probation and corrections, she specializes in case management, cognitive interventions, risk/need assessment, and continuous quality improvement, and is a certified trainer in EPICS-II, Motivational Interviewing, Thinking for a Change, and several risk/need instruments (LS/CMI, WRNA, LSI-R). She has built training curricula for state and local agencies and led statewide implementation of the risk principle across Kansas correctional systems.
In the results, figures, and tables that follow, the three graders are labeled Grader 1, Grader 2, and Grader 3 in an order assigned arbitrarily that does not correspond to the listing above.
Grader independence and a disclosed dual role. Valerie Meade is an independent consultant and a co-author, and she co-designed the rubric and study (see Author Contributions). To keep the human reference standard independent of that design role, all three graders scored the 30 transcripts independently and blind to one another’s scores, and Valerie had no part in the analysis that compares graders or that measures the model against the pool. The rubric was frozen before any grading and is derived from published national standards (§4.3), not from any grader’s personal preferences, and the inter-rater results (§5.2) show wide disagreement among the three graders with no single grader advantaged. We disclose the dual role rather than obscure it, because the safeguard against bias is the blinding and the frozen, standards-based instrument, not the absence of a design contributor from the panel.
Coverage. Two of the three graders produced defined weighted totals on all 30 visits. Grader 3 completed all 30 scoring forms but did not score 5 of them, having marked an entire tier (or every tier) Not Applicable, for the following stated reasons: speaker-attribution confusion in the transcript (visit 003), two visits judged to have “no purpose” (109, 113), one read as a group session rather than an individual supervision visit (001), and one marked “not able to score” (102). We handle these as exclude and report: on those 5 visits the human pool falls back to the other two graders, and the declines are reported transparently rather than imputed over. This is a substantive finding in its own right: in real-world QA, trained auditors sometimes decline to score a visit at all, and a grading pipeline (human or automated) needs an explicit policy for that case.
Grading-style differences among the panel are large and real. The three graders anchor the rubric to different absolute scales: Grader 3 graded systematically more strictly than the other two and made more expansive use of the “not applicable” mark, while still rank-ordering the visits much as her colleagues did (§5.2). We read this as the variability expected among experienced auditors on a demanding instrument, not as evidence that any one grader is the correct standard; it is why the study measures the model against the panel’s spread rather than against a single grader (§4.6), and why a formal adjudication protocol is a natural next step (§8).
Grading was blinded: each grader scored independently, with no shared workspace or joint discussion, blind to the other graders’ scores, to the LLM’s outputs and any prior LLM-vs-human comparisons, and to officer and participant identities (PII redaction in the transcripts).
No norming session, by design. The graders did not hold a calibration or norming session before scoring, because real-world supervision audits do not include one: auditors apply the rubric independently. The inter-rater spread in §5.2 is therefore the authentic operational band an agency would actually see, not an artifact of uncalibrated raters. A wider band does make the model’s agreement easier to match, which is exactly why we rank the model against the graders’ own distances from the pool (Formulation B, §4.6) rather than leaning on any “beats human agreement” framing.
Recompute-don’t-state-subtotals policy. Stated subtotals drift from the values recomputed from item-level Yes/No/NA marks, for the human graders and the LLM alike. Every tier and weighted total in this paper is therefore recomputed from primary item-level data, and stated subtotals are never used. The audit behind this policy is reported in §5.7; the recomputation method is in §4.6.
4.5 Models
- Headline grader: Claude Sonnet 5 (Anthropic) running the S5-001 champion prompt, an autoresearch-adapted descendant of B-iter19 (autoresearch = an automated prompt-optimization loop, §4.7) with one accepted patch (“Visit Substance Gate + functional-credit standard”). The lineage and re-adaptation procedure are described in Section 4.7; the prompt’s availability is addressed in Appendix C. Cold-validated on three independent 30-visit runs.
- Prior baseline grader: Claude Sonnet 4.5 running the B-iter19 prompt, the champion produced by the original autoresearch loop against the original 13-visit calibration set. Reported alongside the headline grader throughout Section 5. B-iter19 run verbatim on Sonnet 5 is also reported as the prompt–model pairing probe (Sections 5.3, 4.7).
- Multi-model probes: the same champion prompt is applied to six non-Anthropic models (GLM-5.2, MiniMax M3, DeepSeek V4 Flash, Gemini 3.5 Flash, GPT-5.5, and Grok 4.3) on the same 30-visit corpus, to characterize cross-model agreement and single-vendor lock-in risk (§5.5).
- Sampling: primary runs at temperature 0 (serving-level nondeterminism is still observed at temperature 0; its magnitude is the run-to-run variation quantified in §5.1). Sensitivity probes at temperature 0.3 across selected visits.
- Grader prompt structure: a single integrated prompt evaluates all 43 rubric items in one pass per transcript, returning a structured JSON object with per-item Yes/No/NA scores, per-item rationale citing transcript spans, tier subtotals, weighted total, and a global commentary field. Prompt availability is addressed in Appendix C.
4.6 Statistics
Score recomputation policy (applies to every grader, human or model). Tier score = Yes ÷ (Yes + No), with NA excluded from the denominator; weighted total = T1 × 0.20 + T2 × 0.30 + T3 × 0.50. Every tier and weighted total in this paper is recomputed mechanically from the grader’s item-level Yes/No/NA marks. Stated subtotals, whether written on a human scoring form or emitted in an LLM’s structured output, are never used. The pipeline does the arithmetic deterministically; no grader is trusted to do its own math. Section 5.7 reports why this policy is necessary for humans and models alike.
Headline metric: Krippendorff’s α. In plain terms, α condenses a panel’s agreement into one number: a value of one means the raters agree perfectly, zero means they agree no better than chance, and negative values mean systematic disagreement. We selected it because it generalizes across binary and ordinal items, handles missing data, and supports any number of raters without restructuring. It is reported per item, pooled across humans, and with the LLM added to the human panel.
Reported alongside α for readability:
- Per-item percent agreement (the number an agency leadership reader will internalize first).
- Per-item Krippendorff’s α across the three graders (Appendix B).
- Pearson and Spearman correlations on tier and weighted-total scores.
- Mean and median absolute Δ between grader pairs on weighted total.
- 95% confidence intervals, computed by visit-level bootstrap: 10,000 resamples, percentile 95% intervals, fixed seed (20260703).
A bootstrap confidence interval is built by re-drawing the 30 visits at random, with replacement, many times over and recomputing the statistic each time; the interval shows how far the number could plausibly move with a different sample of visits. At n=30 these intervals are wide, and we report them wherever they change how a result should be read.
Two words recur throughout the paper and carry fixed meanings: the panel is the three human graders as a group; the pool on a given visit is the set of human graders who produced a defined score for it.
Agreement test: Formulation B (“beat the median human”). For each visit:
- The pool mean is the mean weighted total of all human graders with a defined total on that visit (all three graders on 25 visits; two graders on the 5 visits the third declined).
- Compute the LLM’s distance |LLM −pool mean| and each human’s distance |grader −pool mean|.
- The visit passes if the LLM’s distance is less than or equal to the median of the human distances.
In plain language: on each visit, the LLM must be at least as close to the panel average as the median human grader is. The pass rate across 30 visits is the primary endpoint, reported both as the three-run ensemble and as the single-run range. This framing directly answers the practitioner question (is the LLM as reliable as a trained human auditor?) without a single-true-score assumption the data does not support, and it cannot be satisfied by exploiting wide human disagreement: however far the humans spread, the LLM is still ranked against them, not against the band width. It is conceptually aligned with the OpenAI HealthBench Professional (2026) framing of model-vs-expert-pool agreement against expert-pool-internal agreement.
Why this test. With three graders, the simpler bounded-agreement check below saturates and no longer discriminates between good and mediocre graders, so we adopt Formulation B. That choice was made after examining the data rather than fixed in advance, so this study is exploratory on the choice of acceptance metric; we state the alternatives we considered and report the simpler check wherever it applies. The expanded-corpus study (§8) fixes the primary endpoint and metric set before grading begins, so that analysis is confirmatory.
A simpler check: bounded agreement. In plain terms, this check asked only that the LLM land within the spread the human graders themselves produced on a visit, plus a small tolerance. Formally: a visit passes if the smallest LLM-vs-human absolute difference is no more than the largest pairwise human-human absolute difference on that visit plus a 5 pp tolerance. The check is only moderately demanding when the human band is narrow; with three graders, whose pairwise differences average 19.0 to 33.3 pp, the band widens enough that every artifact we evaluated passes 30/30. A saturated check no longer discriminates between good and mediocre graders, so it is reported as a secondary check only, with the saturation stated plainly wherever it appears.
Length check. We tested whether the grader rewards verbosity by regressing its departure from the human pool on visit length (Appendix D). The residual shows no meaningful dependence on length (slope +0.08 pp per minute, 95% CI −0.21 to +0.36), so no length adjustment was applied.
4.7 How the grader prompt was built and re‐adapted
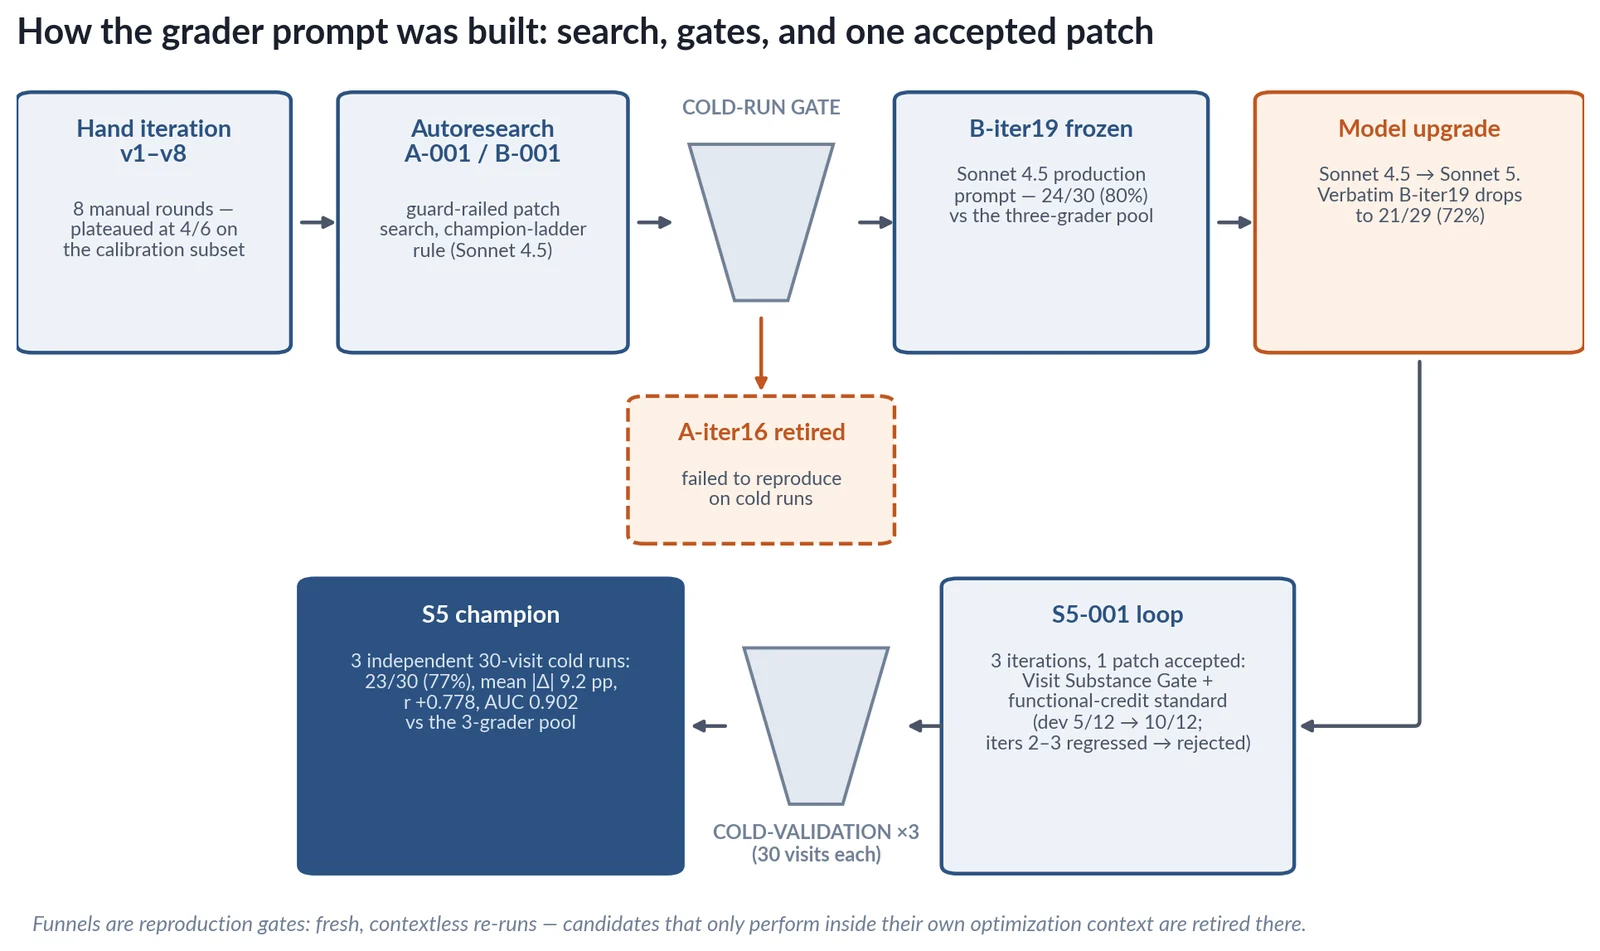
The grader prompt is not a hand-crafted artifact; it is the output of a repeatable calibration procedure. We describe the full lineage because the procedure, not any single frozen prompt, is what an agency would rely on when the model version or the human panel changes.
Stage 1: hand iteration (v1–v8). Eight rounds of manual prompt revision against a small calibration subset improved agreement early, then plateaued, motivating an automated search.
Stage 2: autoresearch with guardrails (runs A-001 and B-001). An automated optimization loop proposed prompt patches and evaluated each against a development subset of visits under a champion-ladder rule: accept only if no previously-passing development visit regresses and the pass count improves (or ties with a material improvement in mean absolute Δ). Every candidate champion then had to survive cold-run validation, fresh and contextless re-grading runs, before promotion. The guardrail did real work: the run-A candidate champion (A-iter16) failed to reproduce its development-set performance on cold runs and was retired. The run-B champion, B-iter19, reproduced cleanly and was frozen as the Sonnet 4.5 production prompt, the prior baseline reported throughout §5.
Stage 3: a model upgrade forces re-adaptation (run S5-001). After B-iter19 was frozen, the headline model was upgraded from Sonnet 4.5 to Sonnet 5. B-iter19 run verbatim on Sonnet 5 degraded (Formulation B 21/29, 72%, vs 24/30, 80%, on its native model): prompt–model pairing is real. The S5-001 re-adaptation loop ran against a 12-visit development subset of the three-grader pool with the same champion-ladder and cold-run rules (cap 15 iterations; stop after consecutive rejections). The loop was short and is reported plainly as such: three iterations, one accepted patch. The verbatim B-iter19 baseline passed 5 of 12 development visits (mean |Δ| 13.22 pp). Iteration 1, the “Visit Substance Gate + functional-credit standard” patch, gates credit on the visit doing actual supervision work and credits functionally-equivalent (non-textbook) demonstrations of rubric behaviors; it passed 10 of 12 (mean |Δ| 9.16 pp) with no regressions and was accepted. Iterations 2 and 3 both caused regressions and were rejected; the loop was stopped after two consecutive rejections to avoid overfitting to a single resistant visit. The accept/reject decision at every iteration used only these 12 development visits; the other 18 visits played no part in selecting or tuning the prompt and entered only the subsequent full-30 cold-run validation (§5.3), so the 16-of-18 holdout figure reported there reflects visits the adaptation never saw.
The prompt–model pairing effect, seen in full: the 2×2. The verbatim-degradation result above is one off-diagonal cell of a natural 2×2. The two frozen champion prompts, B-iter19 (calibrated on Sonnet 4.5) and S5-001 (calibrated on Sonnet 5), can each be run on both models. We completed the matrix by running the Sonnet 5 champion prompt back on Sonnet 4.5 (a single full-30-visit run; all totals recomputed from item-level marks per §4.6). The matrix is diagonal-dominant: each prompt performs best on the model it was calibrated against.
Formulation B vs 3-grader
pool                          Sonnet 4.5             Sonnet 5
B-iter19 prompt (Sonnet 4.5   24/30 (80%) (native)   21/29 (72%) (cross)
champion)
Formulation B vs 3-grader
pool                        Sonnet 4.5            Sonnet 5
S5-001 prompt (Sonnet 5     16/30 (53%) (cross)   23/30 (77%) (native)
champion)
(Headline cells use the reported ensembles; on a like-for-like single-run basis the ordering is identical: native pairings 73% and 77%, cross pairings 69% and 53%.) Two things stand out. First, the effect is symmetric in direction: moving either prompt off its native model costs agreement, so pairing is a property of the prompt–model pair, not simply a matter of one model being better. Second, the penalty is asymmetric in size. The Sonnet 4.5 prompt loses roughly four points of single-run agreement when moved to Sonnet 5; the Sonnet 5 champion loses roughly twenty-four when moved back to Sonnet 4.5 (single-run Formulation B 77% to 53%; mean absolute distance from the pool 8.9 to 16.4 pp). The champion prompt’s central reasoning, the Visit Substance Gate and the functional-credit standard, is executed faithfully by the model it was written against and only loosely by the older one: on Sonnet 4.5 it still recovers a usable quality ranking (AUC 0.82, Spearman ρ +0.59) but its calibration to the human scale drifts, and the misses run in both directions rather than as a clean systematic shift. The practical lesson reinforces Stage 3: a validated grader prompt is not portable across model versions, and the size of the re-adaptation a new model requires cannot be read off the size of the version change.
Stage 4: cold validation of the S5 champion. The accepted prompt was cold-validated on three independent full-30-visit runs (each dispatching 30 fresh, contextless grading sub-agents). The champion generalized: the development subset was only 12 visits, yet 16 of the 18 never-seen holdout visits pass, the only two holdout misses are hairline (0.4 and 1.0 pp over the median-human threshold; §5.8), and every substantive failure case sits on the development subset. This is consistent with no overfitting, though at an 18-visit holdout we cannot fully exclude it, so we let the holdout pass rate carry the generalization claim. Full results in Section 5.3.
The takeaway is procedural: when the model or the panel changes, agreement should be assumed stale, and the recalibration loop (guard-railed patch search plus cold-run validation) is the mechanism that restores it. In this study one accepted, substantively defensible patch was sufficient.
5. Results
5.1 LLM self‐consistency
The champion prompt (Claude Sonnet 5, S5-001) was run three separate times against the 30-visit corpus, with no shared state, no carryover context, and no exposure to any human grader’s scoring or another run’s output; each run dispatched 30 independent grading sub-agents, one per visit. Comparing the three runs to each other is the intra-rater (test-retest) reliability check: does the grader give the same transcript the same score when asked again? All totals are recomputed from item-level marks (§4.6).
Headline intra-rater finding: the LLM agrees with itself on a re-grade better than the two closest human graders agree with each other on a first grade.
                       S5 champion                Sonnet 4.5 B-iter19   Closest human pair
Metric                 run-to-run (Sonnet 5)      run-to-run            (Grader 1 vs Grader 2)
Mean |Δ| on weighted   7.0 / 7.3 / 7.7 pp (runs   9.0 pp                19.0 pp
total                  1–2 / 1–3 / 2–3)
Pearson r              +0.853 (runs 1–2)          +0.706                +0.514
The S5 champion is also more self-consistent than the prior Sonnet 4.5 baseline (7.0–7.7 pp vs 9.0 pp run-to-run), so the model-and-prompt upgrade improved stability as well as agreement. One caution on the comparison: this is the model’s test-retest consistency measured against the humans’ first-grade inter-rater agreement, because no grader re-scored her own visits. The two are not the same quantity; a matched human intra-rater study is the fair comparator and is planned (§8).
Run-to-run variance on the acceptance test is real and must be budgeted for. The single-run Formulation B pass count across the three cold runs was 23, 24, and 20 of 30 (67–80%), a four-visit spread around the ensemble figure. The three-run ensemble (per-visit mean of the three runs) is the honest headline artifact: Formulation B 23/30 (77%), mean |Δ| vs pool 9.2 pp, r +0.778, AUC 0.902. The two-run ensemble of runs 1+2 scores higher (26/30) but partially reflects favorable pairing; we report it alongside, not instead (Section 5.3).
Unstable-visit identification. Two visits had large run-to-run swings: visit 021 (recomputed weighted totals 37.2 / 8.3 / 53.4 across runs 1–3) and visit 104 (25.2 / 35.9 / 51.1). Part of the 021 swing traces to one run marking Tier 3 at the skill-category level instead of the 31-sub-item level (a schema irregularity handled and logged in recomputation; §5.7). These are the corpus’s canonical flag examples: production deployment should flag high run-to-run variance for human spot-check before generating coaching feedback.
Protocol note. Run 3’s dispatch instructions added an explicit requirement to mark all 31 Tier-3 sub-items (runs 1 and 2 each produced a few files with skill-level-only Tier-3 marks). This is a minor protocol difference between runs and is disclosed here rather than smoothed over.
(Per-visit runs-vs-human-band view: see Figure 1, which plots the three-run ensemble against the full three-grader spread.)
5.2 Expert human–human inter‐rater reliability
Trained experts disagree more on this instrument than readers of simpler-rubric studies would expect, and the full three-grader panel is more dispersed than its closest pair. Across the 30-visit corpus, the three expert graders produced:
Grader pair            Mean |Δ| on weighted total (95% CI)   Pearson r (95% CI)
Grader 1 vs Grader 2   19.0 pp (14.9–23.1)                   +0.51 (0.16–0.74)
Grader 1 vs Grader 3   33.3 pp (26.2–40.2)                   +0.59 (0.30–0.79)
Grader 2 vs Grader 3   28.4 pp (23.3–33.4)                   +0.57 (0.33–0.84)
- Krippendorff’s α on weighted total: +0.462 (95% CI 0.11–0.67) for the two closer raters; +0.199 (95% CI −0.06 to +0.37) for the three-rater panel. We report the drop plainly. It is driven by one grader’s stricter scale, not by random noise: that grader’s score correlation (Pearson r) with each of the other two is the highest of any pair (+0.59, +0.57 vs +0.51 for Grader 1–Grader 2). All three graders see broadly the same quality gradient across visits; they anchor it to very different absolute scales.
- Systematic shifts between graders are large. Grader 1 scored higher than Grader 2 by a mean of +7.2 pp. Grader 3 scored well below both across all tiers, most sharply on Tier 1 (the tier of mechanical, checkable behaviors), marking items No or NA that the others credited. These are differences in absolute scale, not in the rank-ordering of visits.
- Tier-level correlations for the closest pair (Grader 1–Grader 2): T1 r = +0.578; T2 r = +0.727; T3 r = +0.069. This is the tightest human pair, so the others are no closer; T3, the largest-weighted tier, is essentially uncorrelated between these two graders on a continuous scale.
The intraclass correlation coefficient (ICC) puts a second lens on the same panel, and it matters which question you ask it. On the 25 complete-case visits (all three graders produced a defined weighted total; k = 3 raters), ICC(2,1), single-rater absolute agreement, asks the same question α asks, how interchangeable is one grader with another? It is 0.317: poor by the Koo and Li (2016) bands (below 0.5 poor, 0.5–0.75 moderate, 0.75–0.9 good, above 0.9 excellent), and consistent with the three-rater α of +0.199. The average-measures forms ask a different question: how reliable is the mean of the three graders’ scores? There the panel does much better: ICC(2,3), absolute agreement of the three-grader mean, is 0.582 (moderate), and ICC(3,3), consistency of the panel mean, is 0.788 (good); single-rater consistency, ICC(3,1), sits between at 0.553. The distinction carries real weight for reading Section 5.3: every LLM comparison in this paper is made against the pool mean, not against any single grader, so the target the model is judged against has meaningfully better reliability than the pairwise grader agreement above would suggest. (Full ICC output in the verification package; Appendix E.)
At the item level, where the rubric actually operates, the graders agree substantially more than the weighted-total α implies (full table in Appendix B). The rubric is a set of binary Yes/No/NA judgments, so the most direct reliability question is how often two trained graders give the same item the same mark. Across the 43 items and 30 visits, Grader 1 and Grader 2 agree on 72.9% of scored items; the pairwise mean across all three graders is 65.4%, and all three assign an identical mark on 45.4% of the items all three scored. Gwet’s AC1, a chance-corrected coefficient that, unlike Krippendorff’s α and Cohen’s κ, is not deflated when one response category dominates the margins, is +0.460 for Grader 1 and Grader 2 and +0.335 averaged across the three pairs. The nominal per-item α is lower (mean +0.124 across items; 5 of 43 reach α ≥+0.4, 17 at or below zero; by tier T1 +0.04, T2 +0.25, T3 +0.11), which reflects the well-documented behavior of α and κ under skewed item margins rather than near-random marking. Taken together, the item-level numbers say the graders agree on most individual judgments and diverge mainly on the absolute scale, not on which behaviors occurred. This is the same pattern OpenAI reports for physician graders on HealthBench (OpenAI, 2025), which measures item-level agreement with macro-F1 and finds its automated grader agrees with physicians about as well as physicians agree with one another; our LLM’s macro-F1 lands in that same band (§5.3). We report α on the weighted total for completeness and comparability, but for a binary-judgment instrument the item-level agreement and AC1 are the more faithful summary, and the deployable coaching score is the weighted total, which is the unit compared against the LLM throughout §5.3. (A single α pooled across all items and visits is about +0.21, consistent with the per-item mean of +0.124 and the weighted-total α of +0.199; the three differ only in aggregation. Item-level detail in Appendix B and the verification package, Appendix E.)
Modest human agreement is the normal backdrop for subjective expert coding, not a peculiarity of this study. Established criminal-justice instruments show the same gap between laboratory and field conditions: the PCL-R reaches inter-rater ICCs of 0.86–0.94 in controlled research but falls to roughly 0.39 among opposing evaluators in real cases (Murrie et al., 2013). In medicine, OpenAI’s HealthBench finds its automated grader agrees with physicians on rubric criteria about as well as physicians agree with each other, and reports that agreement as macro-F1 rather than a single raw-agreement threshold precisely because raw rates are distorted when one response category dominates the margins. This is the reason the present study judges the model against the panel’s actual spread rather than against a single true score that trained experts do not themselves produce, and it is why the chance-corrected α (which assumes such a score exists) understates how usable the panel’s judgments are in practice.
NA-disagreement is a meaningful source of disagreement on Tier 3. Graders disagree not only on Yes vs No but on whether the visit offered an opportunity to demonstrate the behavior at all: the Role Clarification sub-items (T3.6.1–T3.6.3) show heavy NA splits, and one grader’s expansive NA usage extends the pattern corpus-wide. The rubric definition of “context provided opportunity” is a candidate for refinement.
(The full per-item α values are tabulated in Appendix B.)
(Per-visit strip plot of the three graders’ totals: see Figure 1, which shows Grader 3’s severity offset and the preserved rank-ordering.)
What this finding means for LLM evaluation. A bounded-agreement framing, on which the model only has to land inside the human band, is made trivial by a wide band and saturates outright across the three-grader panel (§4.6). That is why our agreement test is Formulation B: the LLM is ranked against the human graders’ own distances from the panel average, so wide human disagreement does not hand it a free pass. A 19-to-33 pp mean disagreement between trained experts reflects how hard supervision visits are to code; the model’s job is to be a credible additional panel member within that reality, not to match a single true score that does not exist.
5.3 LLM–human agreement
All LLM graders were run cold against the 30-visit validation set (independent sub-agents, no carryover state, no exposure to any human grader’s scoring) and evaluated against the three-grader pool under Formulation B (§4.6), with all weighted totals recomputed from item-level marks.
Main results table (all artifacts, recomputed, vs the three-grader pool):
Grading                        Strictly in   Mean |Δ| vs
artifact       Formulation B   band          pool          Pearson r   AUC
B-iter19 on    22/30           23/30         10.9 pp       +0.667      0.784
Sonnet 4.5,
run 1
B-iter19 on    24/30           26/30         10.4 pp       +0.703      0.873
Sonnet 4.5,
run 2
B-iter19 on    24/30 (80%)     25/30         9.5 pp        +0.733      0.856
Sonnet 4.5,
ensemble
(prior
baseline)
B-iter19       21/29 (72%)     23/29         10.4 pp       +0.670      0.800
verbatim on
Sonnet 5,
ensemble
S5 champion    23/30           26/30         8.9 pp        +0.744      0.876
on Sonnet 5,
run 1
S5 champion    24/30           26/30         9.7 pp        +0.767      0.898
on Sonnet 5,
run 2
S5 champion    20/30           22/30         11.7 pp       +0.690      0.853
on Sonnet 5,
run 3
S5 champion,   23/30 (77%)     26/30         9.2 pp        +0.778      0.902
three-run
ensemble
(headline)
S5 champion,   26/30 (87%)     27/30         8.5 pp        +0.785      0.907
two-run
ensemble
(runs 1+2),
non-primary
(“Strictly in band” counts the visits where the LLM’s score falls inside the range the human graders’ own scores span.) Reading the table honestly: the S5 champion is clearly better than the baseline on the continuous metrics (mean Δ, r, AUC) and comparable-to-better on pass counts given the 20–24 single-run spread documented in §5.1. Formulation B pass-count differences of 1–3 visits between artifacts should not be over-read. The two-run 26/30 (87%) figure reflects a favorable run pairing and is reported for completeness only; the primary figures are the three-run ensemble (23/30) and the single-run range (20–24/30). Bootstrap 95% CIs for the headline three-run ensemble: Formulation B pass rate 0.767 (0.60–0.90), mean |Δ| 9.2 pp (7.2–11.3), r +0.778 (0.63–0.88), AUC 0.902 (0.73–0.99). For the two-run ensemble: pass rate 0.867 (0.73–0.97), mean |Δ| 8.5 pp (6.2–11.0), r +0.785 (0.61–0.90), AUC 0.907 (0.75–0.98).
Item-level agreement, and generalization to unseen visits. The figures above are computed on the weighted total. At the item level, where the rubric is a set of binary judgments, the champion ensemble agrees with the individual graders on 67.9% of scored items on average (71.5% with Grader 1, 70.1% with Grader 2, 62.1% with Grader 3) and on 75.0% of items against the human majority. Its per-grader macro-F1 (the balanced average of precision and recall across the mark categories, where one is perfect) runs 0.570 to 0.713, and 0.736 against the human majority, which falls inside the inter-physician band OpenAI reports for HealthBench (OpenAI, 2025; 0.57 to 0.73, with its GPT-4.1 grader at 0.709). The model agrees with the panel at the item level about as well as the graders agree with each other (65.4% pairwise; §5.2), the same conclusion the weighted-total distances reach. Generalization also holds out of sample: the champion prompt was adapted on a 12-visit development subset, and on the 18 visits never used in that adaptation the ensemble passes 16 (89%). The full-corpus 23/30 (77%) includes the 12 development visits, so 16 of 18 is the cleaner estimate of performance on unseen visits. (Item-agreement detail in the verification package; Appendix E.)
The distance matrix: each grader sits closer to the LLM than to either of her human colleagues.
Pair                   Mean |Δ| on weighted total (95% CI)
LLM vs Grader 2        13.0 pp (9.6–16.7)
LLM vs Grader 1        14.9 pp (11.1–18.6)
LLM vs Grader 3        23.0 pp (18.0–27.9)
Grader 1 vs Grader 2   19.0 pp (14.9–23.1)
Grader 2 vs Grader 3   28.4 pp (23.3–33.4)
Grader 1 vs Grader 3   33.3 pp (26.2–40.2)
(LLM = the S5 champion three-run ensemble, the headline artifact; CIs are bootstrap 95% over visits. Distances to Grader 3 use her 25 scored visits.) Every LLM-to-human distance is smaller than the corresponding humans’ distances to each other. This does not depend on ensemble averaging: on single runs (no averaging), the LLM’s mean distances are 16.0, 14.0, and 23.3 pp to Graders 1, 2, and 3, each still smaller than that grader’s distance to either human colleague.
Adding the LLM to the human panel raises agreement. Krippendorff’s α for Grader 1 + Grader 2 is +0.462; adding the champion three-run ensemble as a third rater raises it to +0.552 (CI 0.32–0.68). For the full three-human panel, α is +0.199; adding the LLM as a fourth rater raises it to +0.333 (CI 0.13–0.47). The two-run ensemble shows the same effect (+0.543 and +0.338), as does the prior Sonnet 4.5 baseline (+0.542 and +0.323). An outlier rater added to a panel lowers α; the LLM raises it, behaving statistically like a central member of the panel rather than a fourth divergent voice. This is corroborating rather than independent evidence: adding any rater near the panel centroid tends to raise α by construction, so we read the α increase as consistent with the distance-matrix result (the model sits near the center of the panel), not as a separate proof of quality.
Prompt–model pairing. B-iter19 verbatim on Sonnet 5 performs worse than on its native Sonnet 4.5 (72% vs 80% Formulation B): a newer model does not automatically inherit a prompt’s calibration. Sonnet 5 running B-iter19 also declared visit 113 unscoreable in both runs (hence n=29), the same call one grader made on that visit. The one-patch re-adaptation (§4.7) recovered and exceeded the baseline.
The simpler bounded-agreement check saturates at 30/30. Under that check (minimum LLM-vs-human distance ≤maximum pairwise human distance + 5 pp), every artifact in the table above passes 30 of 30 visits. With three graders whose pairwise differences average 19.0–33.3 pp, the band is wide enough that the check no longer discriminates. It is reported for continuity; it is not evidence of quality beyond what Formulation B already establishes.
Residual failures. The headline three-run ensemble fails Formulation B on seven visits: three near-threshold misses (004, 020, 102, over the threshold by 1.0, 0.4, and 0.1 pp) and four genuinely hard cases (022, 103, 109, 113), analyzed in §5.8, where the human panel itself diverged or declined to score. Five of the seven sit on the 12-visit development subset; the only two holdout failures (004, 020) are the two smallest-margin misses. This is consistent with no overfitting; it can also be read as the patch fitting the development visits, and at n=18 holdout the two readings cannot be fully separated, so we let the holdout pass rate (16/18) carry the generalization claim. (The two-run ensemble of runs 1+2 fails only the four hard cases.)
(Formulation B passes and failures at a glance: Figure 1.)
(The per-visit range-vs-ensemble view is Figure 1: inside the human range on 26/30 visits, closer to the panel average than the median human on 23/30.)
(Per-visit scores for all 30 visits, with each grader’s total, the pool mean, the champion’s score, and Formulation B pass/fail, are in the verification package; Appendix E.)
5.4 Threshold‐based discrimination (AUC and rank correlation)
The Formulation B test in §5.3 is the most informative framing for a graded rubric with a small expert panel, but reviewers familiar with classification-style validation studies will look for an Area-Under-the-ROC-Curve (AUC) statistic. AUC answers a simple question: pick one above-median visit and one below-median visit at random, and ask how often the grader scores the better visit higher. A value of one means it always does; one-half means a coin flip. We report AUC against the three-grader pool mean as the reference standard (not an external ground truth; the threshold is the pool’s own median), noting that AUC reduces a continuous score to pass/fail and so discards information the distance-based framing keeps.
Methodology. Each visit is labeled positive if its pool-mean weighted total (§4.6) is at or above the pool-median across the corpus, negative otherwise, producing balanced classes. AUC is computed with the LLM’s continuous recomputed weighted total as the predictor.
AUC at the pool-median threshold (three-grader pool, recomputed scores):
                                                            Discrimination band (Hosmer
Grading artifact                 AUC                        & Lemeshow)
S5 champion, three-run           0.902 (95% CI 0.73–0.99)   Outstanding (CI to acceptable)
ensemble (headline)
S5 champion, two-run             0.907 (95% CI 0.75–0.98)   Outstanding
ensemble (runs 1+2)
S5 champion, single runs 1 / 2   0.876 / 0.898 / 0.853      Excellent
/3
                                                            Discrimination band (Hosmer
Grading artifact                 AUC                        & Lemeshow)
B-iter19 on Sonnet 4.5,          0.856 (95% CI 0.61–0.98)   Excellent
ensemble (prior baseline)
B-iter19 verbatim on Sonnet 5,   0.800                      Excellent (at boundary)
ensemble
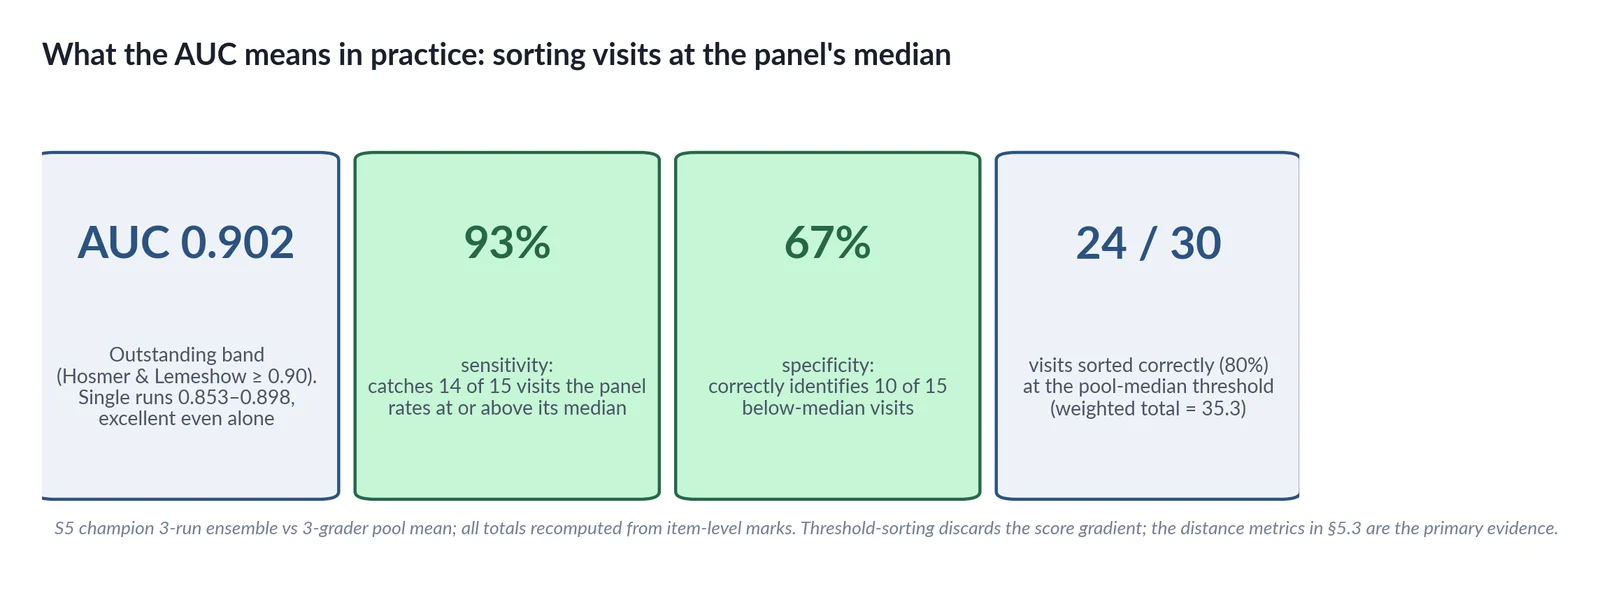
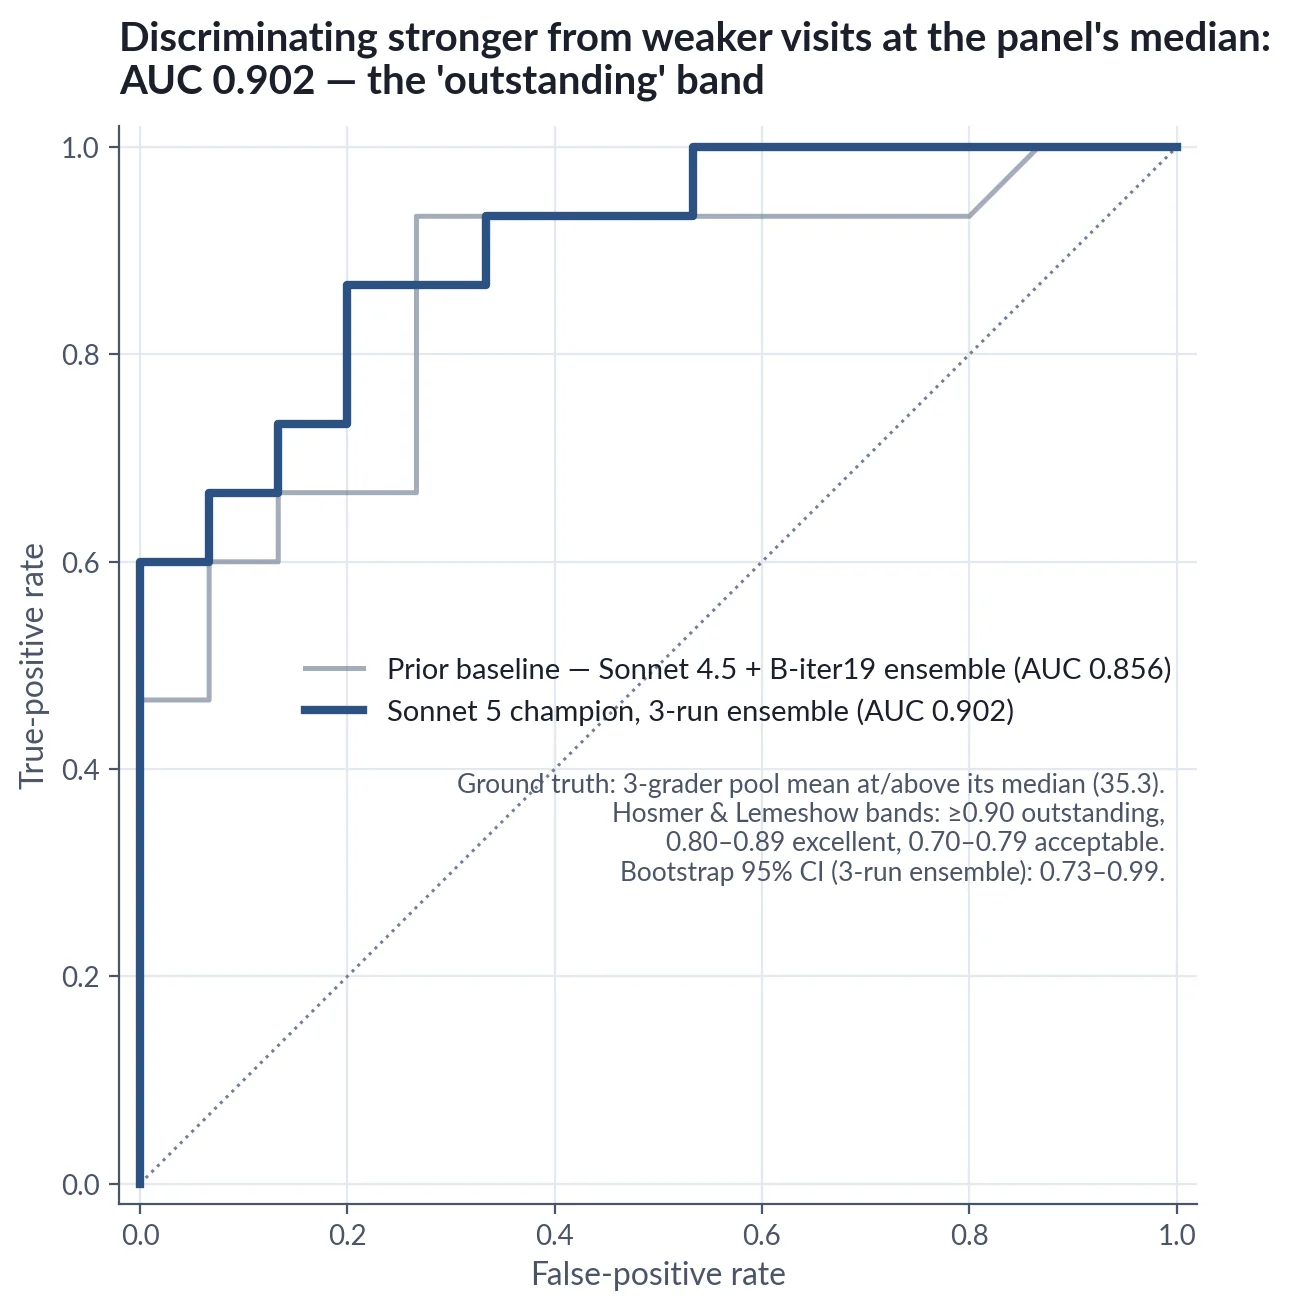
The headline AUC of 0.902 sits in the outstanding discrimination band per Hosmer & Lemeshow (≥0.90 = outstanding; 0.80–0.89 = excellent; 0.70–0.79 = acceptable), and every champion single run stays in the excellent band, so the discrimination result does not depend on ensembling. The bootstrap CIs are wide (0.73–0.99 for the three-run ensemble; 0.75–0.98 for the two-run), as expected at n=30; the lower bound remains in the acceptable-to-excellent range.
Rank correlation. Pearson r against the pool mean is +0.778 for the three-run ensemble (single runs +0.690 to +0.767), versus +0.51 to +0.59 for the human pairs against each other (§5.2). Rank-order agreement tells the same story. Spearman ρ asks a simpler question than Pearson r: do two scorers put the visits in the same order, best to worst? The ensemble’s ρ against the panel average is +0.761 (single runs +0.690 to +0.757), stronger than any human grader’s rank-ordering agrees with the pool of their peers (leave-self-out ρ: Grader 1 +0.543, Grader 2 +0.477, Grader 3 +0.646) and stronger than any human pair agrees with each other (ρ +0.508 to +0.596). The prior baselines land lower: B-iter19 on Sonnet 4.5 ρ = +0.661, B-iter19 verbatim on Sonnet 5 ρ = +0.635.
Circularity caveat for human-as-classifier comparisons. A naive comparison of LLM AUC to “Human A AUC against the pool-mean ground truth” is misleading because Human A contributes to the ground truth she is being scored against. The fair comparison is the distance matrix in §5.3, where every grader, human or model, is measured against the other raters symmetrically.
Bottom line. The 0.902 pool-median AUC and the +0.778 Pearson r against the pool sit alongside the Formulation B pass rate of 77% (single-run range 67–80%) and the 9.2 pp mean distance to the pool mean as a converging set of metrics: on this corpus, the S5 champion discriminates visit quality at least as reliably as the expert panel’s own internal agreement supports measuring it. The result does not hinge on any single visit: leaving out any one visit and recomputing leaves Formulation B at 76–79%, mean |Δ| at 8.6–9.5 pp, r at +0.75 to +0.81, and AUC at 0.86–0.92.
5.5 Cross‐model consistency
Two cross-vendor sweeps ran during this study, and they are reported separately because they rest on different evidentiary bases. The July 2026 sweep is the current one: the S5-001 champion prompt, verbatim and untuned, on six non-Anthropic models, scored under the same rules as the headline result (three-grader pool, totals recomputed from item marks, Formulation B primary). The June 2026 sweep (B-iter19 prompt, stated totals, legacy bounded-agreement test) is retained below as a clearly labeled historical baseline. It is kept partly because its structural findings (mode collapse, moderation refusals, tuning gains) still stand, and partly because comparing the two sweeps is itself a finding: the same vendor’s moderation behavior changed materially between them (see the GPT-5.5 paragraph below).
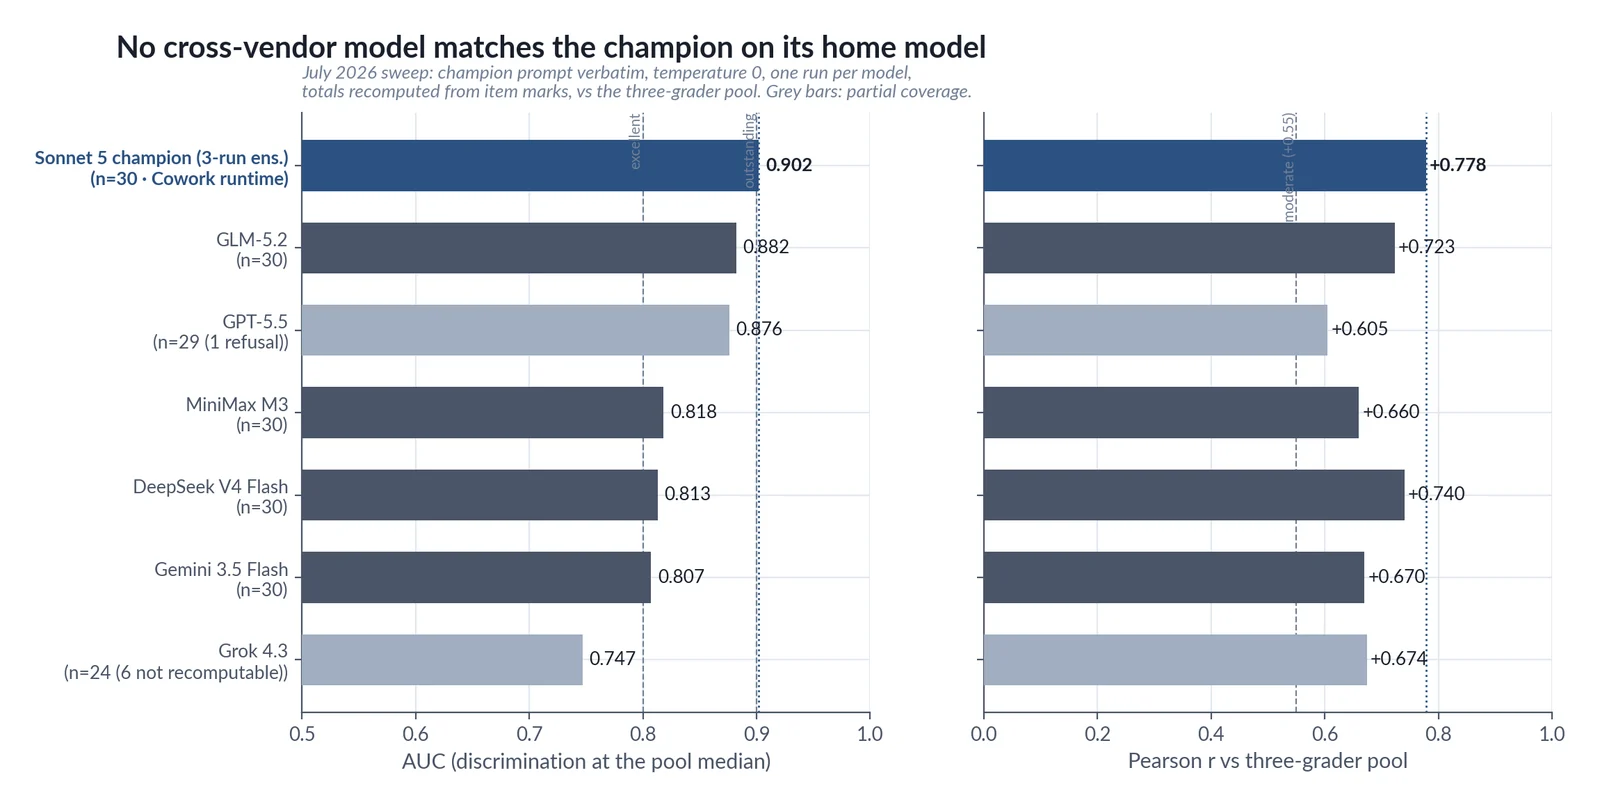
The July 2026 champion-prompt sweep (current basis) The S5-001 champion prompt was run cold against six models via OpenRouter at temperature 0, one run per model per visit, on the same 30-visit corpus (2026-07-04). All totals are recomputed from item-level marks per the canonical policy (§4.6); evaluation is against the three-grader pool under Formulation B. The champion reference row is the Sonnet 5 three-run ensemble, which ran on a different runtime (Cowork sub-agents, not OpenRouter): its cost and latency are not comparable and are omitted, and the single-run cross-vendor rows are fairly compared against the champion’s single-run range (Formulation B 20–24/30) as much as against the ensemble.
GLM-5.2 retry footnote. Five GLM-5.2 visits (022, 068, 078, 102, 113) failed on the first pass and were re-run with reasoning disabled; their item marks are complete and were recomputed exactly like all others. (GLM-5.2 also fills its self-reported grader_model header field with six different confabulated “Claude…” strings across the run. This is harmless under the recompute policy, and further evidence that model-stated metadata, like model-stated totals, cannot be trusted.)
Coverage classification. Preliminary recomputes left 23 visits across four models with an undefined weighted total (an entire tier with no usable marks). Before the table below was built, every such visit was opened and classified into one of three cases: (a) a genuine substance-gate firing (the model legitimately NA’d a whole tier, as one human grader did on five visits); (b) a schema mismatch (the model emitted complete item marks in a JSON dialect the recompute parser did not yet read); or (c) genuinely missing item marks (incomplete grading). The result: no visit in any model was case (a); 17 visits (11 Gemini, 5 MiniMax, 1 GPT-5.5) were case (b): mark keys status and yes_no_na and one dictionary-valued sub-item container, and were recovered by extending the parser (regression-checked byte-identical on the champion’s run 1); and Grok 4.3’s six visits (001, 011, 065, 068, 111, 113) were case (c): Grok never emitted the 31 Tier 3 item marks in any of its 30 visits, and on those six it produced only model-stated per-skill percentages, which are not recomputable and are excluded (n = 24). Two residual coverage caveats are disclosed: Grok’s 24 evaluable visits score Tier 3 from 9 skill-level marks rather than 31 items (coarser granularity throughout), and Gemini graded one visit’s Tier 3 mostly at skill level (12 of 31 marks). Full audit in the verification package (Appendix E).
Champion-prompt cross-vendor table (July 2026; recomputed totals; vs three-grader pool). The top row is the Sonnet 5 champion three-run ensemble, shown as the reference; it ran on a different runtime (Cowork sub-agents), so its cost and latency are not comparable and are omitted.
                          Formulation In     Mean      r vs     ρ vs
Model      n (coverage)   B           band   |Δ|       pool     pool     AUC   Unique Latency
Sonnet 5   30 (full)      23/30      26/30   9.2 pp    +0.778   +0.761   0.902 30/30   n/a
champion                  (77%)
(ref.)
GLM-5.2    30 (full; 5    20/30      22/30   12.3 pp   +0.723   +0.752   0.882 27/30   107 s
           retries        (67%)
           reasoning-
           off)
MiniMax
30 (full) 21/30
23/30 10.8 pp +0.660 +0.653 0.818 30/30 182 s
M3                        (70%)
DeepSeek    30 (full)     19/30   21/30   12.9 pp   +0.740   +0.658   0.813 27/30   100 s
V4 Flash                  (63%)
Gemini      30 (full; 1   19/30   23/30   12.6 pp   +0.670 +0.614     0.807 26/30   11 s
3.5 Flash   coarse T3)    (63%)
GPT-5.5 29 (visit 021
14/29
14/29 19.1 pp +0.605 +0.733 0.876 27/29 86 s
           refused)      (48%)
Grok 4.3   24 (6 visits  11/24   14/24   17.9 pp   +0.674   +0.536   0.747 16/24   12 s
           T3 not        (46%)
           recomputable)
Nothing matches the champion on its home model. The best cross-vendor result on every headline metric still trails the Sonnet 5 champion: Formulation B 70% (MiniMax) vs 77%; mean |Δ| 10.8 vs 9.2 pp; AUC 0.882 (GLM) vs 0.902; r +0.740 (DeepSeek) vs +0.778. The champion prompt was autoresearched on Sonnet 5, and the pairing carries real signal. It is the same pattern as B-iter19 (tuned on Sonnet 4.5) dropping from 24/30 to 21/29 when moved verbatim to Sonnet 5 (§5.3). On this corpus, and with single-run cells at n=30, this is consistent with prompt–model pairing dominating vendor tier rather than a firmly established causal claim. The cross-vendor figures come from a single run per model, so they should be read as provisional floors, not ceilings. We omit per-visit dollar figures, which change frequently and are a procurement detail; the durable point is the ordering: open-weight models cost substantially less per case than hosted closed models, which in turn cost less than frontier closed models.
GLM-5.2 is the best cross-vendor discriminator. Its AUC (0.882) and rank correlation (ρ +0.752) are the highest outside the champion, with full 30-visit coverage. It is the current “close-but-below” candidate: if a model-specific autoresearch loop is ever justified at the cost frontier (the DS-iter44 pattern, §8), GLM-5.2 is now the natural target.
DeepSeek V4 Flash is the best budget full-coverage grader. An open-weight model, it is markedly cheaper per case than the hosted closed models, and it posts the best cross-vendor Pearson r (+0.740) and emitted all 31 Tier 3 item marks on every visit (in four JSON dialects, all parsed and recomputed).
MiniMax M3 is the closest cross-vendor scorer (Formulation B 21/30; mean |Δ| 10.8 pp; 30 unique scores in 30 visits, no mode collapse), but it is the weakest full-coverage model on rank-order metrics (r +0.660, AUC 0.818) and the slowest in the sweep (median 182 s per visit; it is a reasoning model). Its preliminary “partial coverage” (n = 25) was entirely a parser artifact and is resolved above.
Grok 4.3 is the worst value in the sweep. It is fast (12 s), but it never emitted the 31 Tier 3 item marks in any visit, leaving six visits unscoreable under the canonical policy and the remaining 24 scored at coarse granularity. On those 24 it posts the sweep’s lowest AUC (0.747) and ρ (+0.536), with 16 unique scores in 24 visits. DeepSeek is cheaper and better on every quality metric.
GPT-5.5’s refusal rate collapsed from ~28% to 3% between sweeps, and the residual refusal is reproducible. In the June 2026 B-iter19 attempt, 5 of 18 visits drew a canned refusal and the run was cancelled. In this sweep, GPT-5.5 graded 29 of 30 visits, but visit 021 still returns the identical canned string: “I’m sorry, but I cannot assist with that request.” Both halves of that movement are governance findings. First, vendor moderation behavior drifts: a model that refused ~28% of this corpus in June grades 97% of it in July, with no change on our side beyond the prompt version. A deployment on a moderated third-party API therefore needs contractual or technical protection against silent moderation-policy changes, in both directions. Second, the residual refusal is not noise: it is stable, content-triggered, and unappealable at the API level. On the 29 visits it did grade, GPT-5.5 rank-orders well (ρ +0.733, AUC 0.876) but sits ~19 pp lenient of the pool (the sweep’s worst calibration) at 5–50× the price of every model above it in the table.
Schema compliance is a real cross-vendor discriminator. The six models produced at least seven distinct item-mark schemas between them (score, rating, value, status, yes_no_na, boolean yes, bare strings, plus one dictionary-valued container). Sonnet followed the specified output schema exactly in all 90+ cached cold-run files. Every non-Sonnet deployment therefore needs either a schema-enforcement harness (function calling / constrained decoding) or a deterministic repair pass, and “recomputable output” belongs in any procurement requirement list.
Historical note: the June 2026 cross-model sweep An earlier cross-model sweep (June 2026) used the B-iter19 prompt with a legacy bounded-agreement test and the models’ stated totals, so its pass rates are not comparable to the July table above and are not carried forward. Three structural findings from it still hold, and they inform the current recommendation. First, model-specific tuning can close the cross-vendor gap. DeepSeek V4 Flash ran the Sonnet-tuned prompt at Pearson r +0.62 (80% pass); its own autoresearched prompt (DS-iter44) reached r +0.64 and 90%, matching the Anthropic models on agreement. Second, some models fail structurally rather than on accuracy. Llama 3.3 70B mode-collapsed, returning the same weighted total on 18 of 29 visits (only 5 distinct values across the whole corpus) and passing the bounded test only because a constant answer lands inside a wide human band by chance. Third, GPT-5.5 refused about 28% of visits in June with a canned content-moderation message. That is the “before” half of the moderation-drift finding above. The full June results are in the verification package.
Production deployment recommendation (July 2026 sweep). The accuracy pick is the Sonnet 5 champion (S5-001 prompt, ensemble), the headline artifact of this study and the only configuration validated at ensemble depth; no cross-vendor configuration matches it untuned. For a budget full-coverage tier, DeepSeek V4 Flash, an open-weight model, runs the champion prompt at a fraction of the closed models’ per-case cost, with the best cross-vendor correlation and complete item marks on every visit. It sits below the acceptance bar as a standalone grader (Formulation B 63%), so it fits high-volume triage feeding human or champion-model review, or a model-specific autoresearch loop (the DS-iter44 pattern took this same model from 80% to 90% on the earlier test). GLM-5.2 is the best cross-vendor discriminator, with the highest AUC and rank correlation outside the champion at full coverage, and is the current close-but-below candidate for tuning. MiniMax M3 is the closest cross-vendor scorer but the weakest full-coverage rank-orderer and the slowest. Two models are not deployable as routine graders: Grok 4.3 never emits Tier 3 item marks and fails the recomputable-output requirement, and GPT-5.5 carries a moderation-drift risk (one reproducible refusal now, about 28% a month earlier) at the sweep’s worst calibration, and as a frontier closed model it is also the most expensive per case. The per-model figures behind these verdicts are in the table above.
5.6 Operational subgroup analysis
The 30-visit corpus is stratified to support subgroup analysis by case type and supervision level. We recomputed the primary Formulation B pass rate, mean |Δ| vs the three-grader pool, and Pearson r within each subgroup using the headline three-run ensemble as the LLM’s score. The human-band column is the mean, within the subgroup, of the maximum pairwise human |Δ| per visit.
Subgroup gap criterion (pre-specified in the analysis plan). We flag for investigation any subgroup with LLM-human agreement more than 10 percentage points below the pooled pass rate; this 10-point threshold was fixed in the pre-registered plan before the subgroup analysis was run.
Case type (clean 10/10/10 split):
Case Type         n    Form B pass (3-run ensemble)   Mean Δ    Pearson r   Mean human band
Adult             10   7/10 (70%)                     7.5 pp    +0.719      31.6 pp
Juvenile          10   10/10 (100%)                   8.8 pp    +0.874      46.7 pp
Treatment Court   10   6/10 (60%)                     11.4 pp   +0.790      33.9 pp
Pooled            30   23/30 (77%)                    9.2 pp    +0.778      37.4 pp
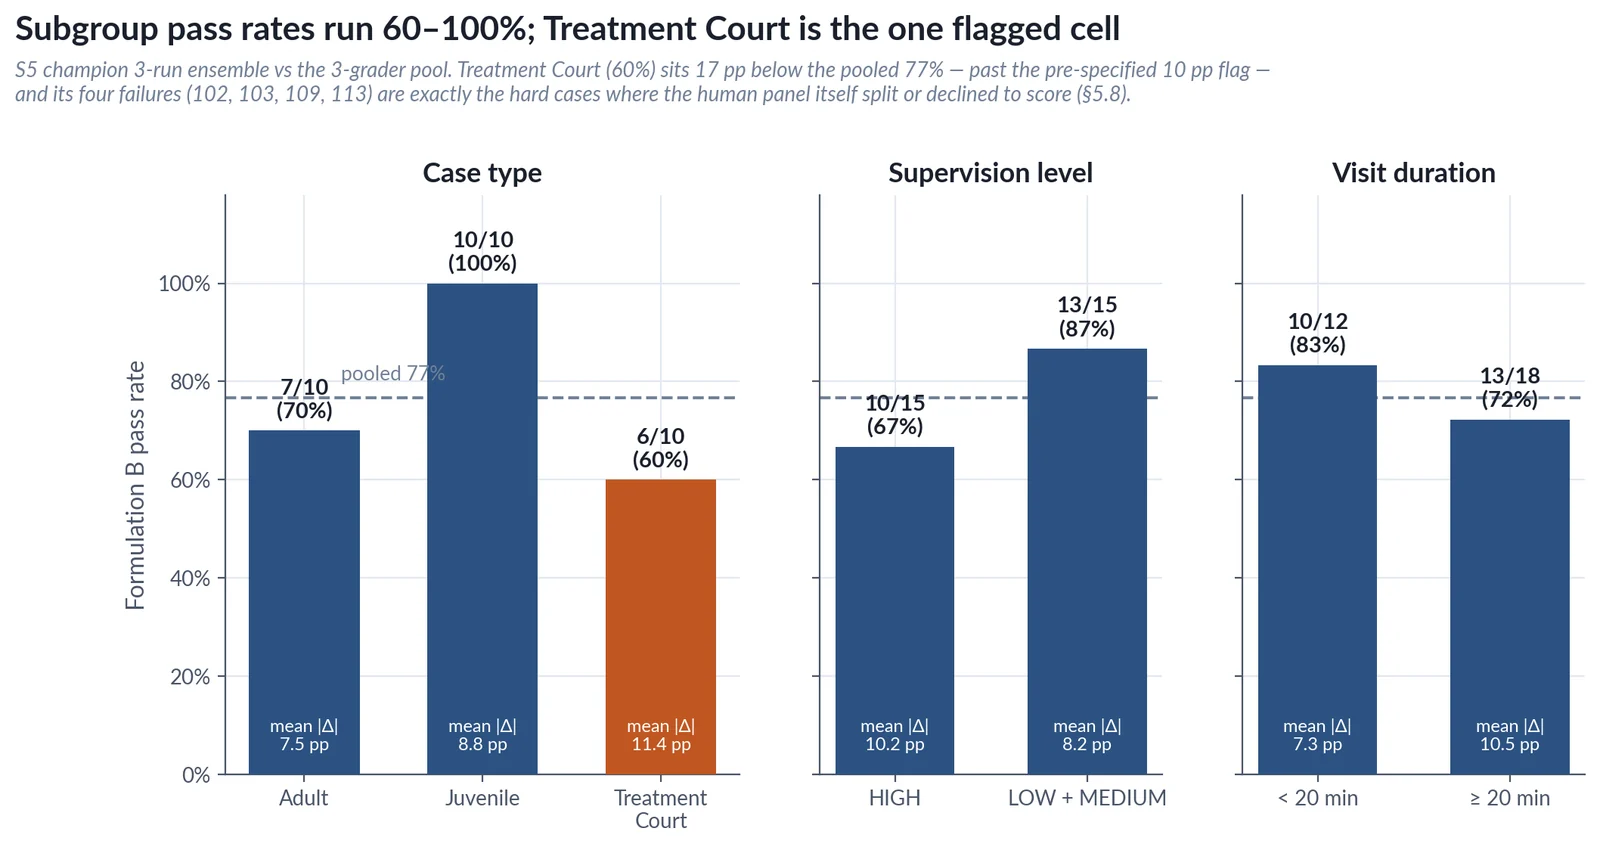
Treatment Court is the one subgroup where the model clearly underperforms. At 6/10 (60%) against a pooled 77%, Treatment Court sits 17 percentage points below the pooled pass rate, the largest subgroup gap in the study, and we report it plainly. What the investigation shows: the four Treatment Court failures are exactly the corpus’s known-hard visits analyzed in §5.8: 109 (the no-purpose visit), 113 (the collateral-contact call), 103 (a contested visit with wide panel spread), and 102 (a hairline miss, 0.1 pp over the threshold, on a visit one grader marked “not able to score”). The human panel shows difficulty on this subgroup too, though it shows up as declines rather than as band width: three of Grader 3’s five declined visits (102, 109, 113) are Treatment Court visits, so the pool falls back to two graders on 3 of the 10. The Treatment Court human band itself (33.9 pp) is mid-range, narrower than Juvenile’s 46.7 pp, so the shared-difficulty claim rests on the declines and on the §5.8 case analyses, not on wider human disagreement. On the model side, rank tracking within the subgroup stays strong (r +0.790, above pooled), so the evidence points to a cluster of pathological visits (purposeless, collateral, unscoreable) that happen to concentrate in Treatment Court rather than a general Treatment-Court blind spot. Either way the operational implication is unambiguous: in deployment, Treatment Court visits are first in line for human spot-check, and the corpus expansion should oversample Treatment Court to determine whether the gap is these four visits or the category.
Two secondary stratifications add nothing beyond the case-type picture. By supervision level, HIGH visits pass 10/15 (67%) and non-HIGH (LOW plus the 3-visit MEDIUM cell) 13/15 (87%), but four of the five HIGH failures are the same Treatment Court visits, so this is not an independent gap. By visit duration, short and long visits pass at 83% and 72% with near-identical rank tracking, and a direct test finds no verbosity bias (Appendix D). Neither stratification approaches the Treatment Court shortfall.
Subgroup summary. One subgroup underperforms: Treatment Court, at 60% vs 77% pooled (−17 pp). The failing visits are the corpus’s known-hard cases, three of which Grader 3 declined to score at all, and the model’s rank tracking within the subgroup remains strong. The gap stands regardless, so Treatment Court visits should be routed to human spot-check first in any deployment. No other subgroup shows a gap of this size. Treatment Court transcripts also carry a higher share of unscorable visits (no-purpose, collateral-contact, or otherwise non-standard contacts), which is where both the model and the human panel struggle most.
Cell-size limitation. Subgroup cells of 10 visits are small; a single visit moves a cell by 10 points, so the subgroup results are directional rather than precise. An expanded corpus (v1.1) will produce more powered subgroup tables and resolve whether the Treatment Court gap is visit-specific or categorical.
Demographic subgroups (officer race/gender, participant race/gender, agency-region) are not in the corpus metadata and therefore not analyzed. This is a deliberate limitation tied to the tool’s coaching positioning. Demographic equity analysis becomes appropriate only if the tool is ever scoped toward a personnel-decision-adjacent workflow, which this validation does not support. See Section 7 (Limitations).
5.7 Arithmetic‐accuracy comparison
A routine audit of every grader submission compared each rater’s stated tier subtotals and weighted totals against the values recomputed from the underlying item-level Yes / No / NA marks. The finding is symmetric, and the symmetry is the point: no grader, human or model, reliably does its own aggregation arithmetic, so the pipeline does it for everyone.
Human arithmetic-accuracy findings. Auditing each grader’s stated tier subtotals against the values recomputed from that grader’s own item-level marks, across the full 30-visit corpus, turned up discrepancies for all three graders: Grader 1 on 4 of 30 visits, Grader 2 on 7 of 30, and Grader 3 on 17 of 30. Most were small (the majority move the weighted total by under 2 pp, and several net to zero), but some were material: one grader’s Tier 1 subtotal on visit 003 was off enough to shift the weighted total by about 4 pp, and the largest single-visit weighted shift was about 7 pp. Grader 3’s discrepancies are the most frequent and include tier percentages inconsistent with that grader’s own Yes/No/NA counts as well as counts inconsistent with the item marks. In every case the item-level marks were internally coherent and were taken as the source of truth; all three graders’ scores in this paper are recomputed from them.
LLM arithmetic accuracy. Recomputing every cached LLM cold run from its item-level marks shows that the model’s stated weighted totals drift from its own item-level marks in every run, usually by 1–4 pp but up to 13.3 pp (Sonnet 4.5 run 1, visit 104: stated 52 vs recomputed 38.7; visit 110: stated 32 vs 20.3; visit 068: stated 64 vs 77.1). Roughly 20 of 30 visits per run drift by 0.5 pp or more. The LLM makes the same class of arithmetic-summary error the humans make: its item marks are reliable; its stated math is not.
Impact check. Recomputation barely moves the headline metrics. The Sonnet 4.5 baseline ensemble stays at 24/30 on Formulation B, mean |Δ| 9.5 pp, r +0.733, so the pre-recomputation results stand. But every published v1.0 number is built on recomputed totals, and the drift is disclosed here as a finding rather than silently patched.
Schema irregularities, logged. Recomputation also surfaced and handled structural irregularities in LLM outputs: three visits graded at the Tier-3 skill-category level instead of the 31-sub-item level (S5 champion run 1 visit 020; run 2 visits 021 and 067, 9 marks instead of 31), and one missing sub-item mark (Sonnet 5 B-iter19 run 2, visit 104, item T3.1.1), which was excluded from that tier’s denominator.
Why this is a fourth variability metric, not a footnote. Inter-rater disagreement and intra-rater drift are intrinsic to subjective judgment. Aggregation arithmetic is mechanically eliminable, for humans and for models. The improvement is not “the LLM does arithmetic and humans don’t”; it is that a deterministic pipeline recomputing from item-level marks removes this error class for every grader. Any deployment that trusts stated totals, whether from a scoring form or a model’s JSON, is importing an avoidable error source.
Policy implication. For any deployment of this grader, automated or human, recompute tier and weighted totals from primary item-level data. Never trust stated subtotals, regardless of who or what stated them.
5.8 Categorized error analysis
The headline grader’s seven Formulation B failures (004, 020, 022, 102, 103, 109, 113) decompose cleanly into two groups. Four (022, 103, 109, and 113) are the corpus’s genuinely hard cases: all sat on the development subset, all fail the two-run ensemble as well, and they carry the instructive patterns analyzed below. The other three (004, 020, and 102) are near-threshold misses: the ensemble’s distance to the pool exceeds the median human grader’s distance by 1.0 pp (visit 004: 11.1 vs 10.1), 0.4 pp (visit 020: 7.6 vs 7.2), and 0.1 pp (visit 102: 14.8 vs 14.7). These are genuine hairline cases, though 102 belongs partly with the hard group (a Treatment Court visit one grader declined, where the pool rests on two graders). Visits 004 and 020 are the only failures from the 18-visit never-seen holdout and the two smallest-margin misses in the set, which is consistent with no overfitting (the 18-visit holdout is too small to exclude it outright). Two further visits, 021 and 104, are not stable failures but show large run-to-run swings (§5.1) and are the canonical flag-for-human-review examples.
Pattern 1: Over-credit on purposeless-but-mechanically-present visits (the 109 type). Visit 109 wanders (moon landings, ghosts) with no supervisory purpose; one grader declined to score it outright (“no purpose”), and the remaining pool scored it very low (mean 16.8). The champion ensemble scored it 42.8: rapport-like talk and listening cues are mechanically present, and the prompt’s Visit Substance Gate, which exists precisely to catch this case, still under-fires on it. Visit 109 was the most resistant visit throughout the S5-001 loop (§4.7); both attempted gate-strengthening patches regressed other visits and were rejected. This is the champion’s clearest residual weakness, on a visit where the human panel itself split between “score it near zero” and “decline to score it at all.”
Pattern 2: Zeroing a collateral-contact call (the 113 type). Visit 113 is a collateral-contact call rather than a standard supervision visit. The champion effectively zeroes it (runs 1 and 2 score it 0.0 outright, run 3 scores it 14.3, and the three-run ensemble lands at 4.8 vs the pool mean of 17.7; Grader 3 declined 113, so that pool is the other two graders), ruling it ungradable-as-a-visit and scoring accordingly. This is the same judgment two other graders reached independently: one grader declined to score 113 (“no purpose”), and B-iter19 on Sonnet 5 declared it unscoreable in both runs. The disagreement here is a rubric-policy question, whether collateral contacts are in scope for visit grading at all, not an LLM perception error. The cleanest fix is an explicit corpus-inclusion rule, which would benefit human and automated grading equally.
Pattern 3: Residual distance failures on contested visits (022, 103). Visits 022 and 103 fail the Formulation B distance test without a single dominating cause; both were visits with meaningful spread in the human panel, and both sat on the development subset where the accepted patch improved but did not fully close the gap. They are per-item review candidates for the next prompt or rubric iteration.
Counts and operational implications.
Pattern                          Visits          What it tells us
1: Over-credit on purposeless-   109             Substance-gating is the right
but-mechanically-present                         idea but under-fires on the
visits                                           hardest case; humans split
                                                 between near-zero and
                                                 decline
2: Collateral-call zeroing       113             Corpus-inclusion policy
                                                 question, not a perception
                                                 error; one human and one
                                                 baseline model made the
                                                 same call
3: Residual distance failures    022, 103        Per-item review candidates
on contested visits                              for the next iteration
4: Near-threshold misses         004, 020, 102   Fail by 0.1–1.0 pp against the
                                                 median-human threshold;
                                                 within run-to-run noise of
                                                 passing (004 and 020 are the
                                                 only holdout failures)
Pattern                          Visits     What it tells us
Flag-not-fail: high run-to-run   021, 104   Production flag rule (§5.1)
variance                                    routes these to human
                                            spot-check
The common thread: the champion’s substantive residual failures concentrate on exactly the visits where the human panel itself diverged sharply or declined to score, and the rest are hairline. The model is not failing on visits the humans find easy; it is failing on visits the instrument itself handles worst.
No evidence-hallucination cases observed. A spot-check on the B-iter19 baseline outputs examined whether the LLM cited evidence spans that did not appear in the transcript (a known failure mode for prompt-engineered graders). Across 12 grading outputs reviewed at item level, every “Yes” item cited an actual transcript phrase or exchange. A follow-up quote-level audit of the champion itself checked all 153 verbatim evidence citations across its three cold runs (90 grading files): zero fabricated quotations. 78% matched the transcript verbatim after normalization, and all 33 initially-flagged cases resolved on manual review to benign categories: ellipsis compressions of two real spans, faithful condensations, quotes spanning redaction tokens, or explicitly hypothetical rubric exemplars quoted to justify a “No.” (One instructive case: the grader silently corrected an obvious speech-to-text artifact, which is transcript-noise handling, not fabrication.) The audit covers quoted evidence only; unquoted assertions in comments were not systematically audited, though spot reading during adjudication found them consistent with the transcripts. Method and adjudication log in the verification package (Appendix E).
No intent-imputation cases observed. The prompt instructs the model to grade observed behavior only, not imputed officer intent. Spot-checks of items where the LLM marked “Yes” and humans marked “No” surfaced no violations of that rule. The divergences are rule-interpretation differences (what counts as MI-adherent, what counts as a Tier 2.3 intervention), not rule violations.
6. Discussion
6.1 What the model does well
It tracks the panel average more closely than the panel members track each other. The distance matrix in Section 5.3 is one of the clearest results in the paper: the ensemble sits 13.0 pp from Grader 2, 14.9 pp from Grader 1, and 23.0 pp from Grader 3, while the human pairs sit 19.0, 28.4, and 33.3 pp apart. In every case the model is nearer to a grader than that grader’s human colleagues are. Adding the LLM to the human panel raises Krippendorff’s α (+0.199 to +0.333 for the three-human panel; +0.462 to +0.552 for Grader 1 and Grader 2 alone). A divergent rater drags α down; a central one pulls it up. The model behaves like a central member of the panel. As in §5.3, we read this α increase as corroborating rather than independent evidence: adding any rater near the panel centroid raises α by construction, so it confirms the distance-matrix result rather than proving quality on its own.
Substance-gating fixed the earlier over-credit on low-content visits. The one patch accepted in the Sonnet 5 re-adaptation loop gates rubric credit on the visit doing actual supervision work, and credits functionally-equivalent rather than only textbook-worded demonstrations. On the 12-visit development subset it took the verbatim baseline from 5 passes (mean |Δ| 13.2 pp) to 10 (mean |Δ| 9.2 pp) with no regressions, and it generalized: 16 of the 18 never-seen holdout visits pass, and the two that fail miss by at most 1.0 pp (§4.7, §5.3, §5.8). Visits that go through the motions without doing supervision work now score low, the way the human panel scores them, with one residual exception (visit 109, below).
It repeats itself better than the humans, and better than its own predecessor. Across three independent cold runs, the S5 champion’s run-to-run mean |Δ| is 7.0–7.7 pp, versus 9.0 pp for the Sonnet 4.5 baseline and 19.0 pp for the closest human pair (§5.1).
It is strongest at the level where the instrument itself is reliable: the visit-level weighted total. Even trained humans agree only weakly item-by-item (mean per-item α +0.124; §5.2); the rubric’s reliability lives in the aggregate score, and the LLM’s agreement has the same shape (visit-level totals tracking the pool at r +0.778). That is a further reason the reliable signal is the visit-level score and its cited evidence spans, rather than any single item mark read in isolation.
6.2 What the model does not do well, and why
The S5 champion’s residual weaknesses are few, well-characterized, and concentrated on exactly the visits the human panel handles worst. The difficulty is shared, not model-specific.
Over-credit where the mechanics are present but the purpose is absent (visit 109). On a purposeless visit the pool scored very low, yet the ensemble scored it far higher because rapport-like talk and listening cues are mechanically present. The substance gate added precisely to catch this case still under-fires on it (§5.8). This is the clearest residual weakness.
Zeroing the collateral-contact call (visit 113). Visit 113 is a collateral-contact call, not a standard supervision visit, and the ensemble effectively zeroes it. One grader and the B-iter19 baseline on Sonnet 5 independently reached the same “unscoreable” judgment. The fix here is a corpus-inclusion policy, deciding whether collateral contacts are in scope at all, not a better model (§5.8).
Run-to-run instability on two visits (021 and 104). These visits swung by tens of points across cold runs (§5.1). They pass or fail the acceptance test depending on the run, and they are the canonical examples for the production flag rule: high run-to-run variance routes a visit to human review before any coaching feedback is generated.
Tier 3 NA-rule interpretation: a weakness the model shares with the humans. Many Tier 3 sub-items require judging whether the visit offered any opportunity to demonstrate the behavior, and the three humans themselves span a wide range on that judgment (mean Tier 3 NA counts of 3.8, 13.3, and 18.2 out of 31; §5.2), so when the LLM’s NA choices diverge from one grader’s, they typically land inside another’s range. The cleanest fix is rubric refinement of the Tier 3 NA rules, which would help human graders at least as much as the model.
The remaining substantive distance failures (visits 022 and 103) have no single dominating cause; both had meaningful panel spread and are per-item review candidates for the next iteration, and three further failures (004, 020, 102) are near-threshold misses of 0.1–1.0 pp, not substantive disagreements (§5.8). The flagged Treatment Court gap (§5.6) is carried by the hard cases above (102, 103, 109, and 113 are all Treatment Court visits), which is why Treatment Court is first in line for human spot-check in deployment. Smaller-model and cross-vendor failure modes are covered in Section 5.5.
What the expert panel teaches about human QA itself. The most useful lesson in this study may not be about the model at all. A panel of trained experts does not converge on a single standard; it occupies a wide band. Severity differences between trained graders are large: the full-panel α (+0.199) sits well below the closest-pair α (+0.462) because one grader, though internally consistent, scores on a much stricter scale, even though her rank-ordering of visits matches her colleagues’ as well as theirs match each other. Trained graders sometimes decline to score a visit at all: 5 of 30 here, with documented reasons. And human arithmetic errs routinely: stated subtotals disagreed with recomputed values for all three graders, on 4, 7, and 17 of 30 visits. None of this is a criticism of these graders; it is what expert judgment on a hard instrument looks like, and any agency running a human audit program is already living with all of it, usually invisibly, because most visits are scored by exactly one auditor and nobody recomputes the math. The right comparison standard for an AI grader is therefore the band trained humans actually occupy, not an imagined gold standard of expert unanimity. By that standard, this model sits nearer the center of the panel than any human member does, and repeats itself more reliably. An agency evaluating this tool should be ready to ask the same questions of its existing audit program that this paper asks of the model.
6.3 What this means for an agency considering deployment
The empirical case for sustained fidelity monitoring is the strongest argument for deploying a tool like this. As §3.1 laid out, training reduces recidivism only when officers maintain fidelity over time (Labrecque et al., 2022); fidelity has only ever been measured through human-coder review that cannot scale; and the studies that described their training relied on booster sessions to sustain the effect (Chadwick et al., 2015). The deployable version of this tool is the continuous booster that has historically been operationally infeasible.
Portela et al. (2024) support the workflow shape from a different domain (§3.1): algorithmic support improved human predictive accuracy, and professional users preferred to keep an expert in the loop rather than defer to a fully automated system, the advisory, override-capable mode this paper recommends (§9).
The validation in this paper extends those findings to community corrections supervision visits. On the 30-visit corpus, the S5 champion ensemble was at least as close to the panel average as the median human grader on 23 of 30 visits (77%), sat closer to each grader than that grader’s human colleagues sat to each other, and raised the panel’s agreement statistic when added to it (§5.3). The recommended workflow is the empirical version of “human + AI outperforms either alone”: the LLM scores every visit, the pipeline recomputes every total mechanically from item-level marks (§5.7), and flagged visits (high run-to-run variance, scores at the edge of the human band) route to a human reviewer with override authority. Two properties of that workflow are worth stating directly. The deployed grader is the three-run ensemble, not a single run, so the operative reliability is the ensemble’s rather than the poor single-rater figure of §5.2; and single-run scores, which swing by up to four visits on the agreement test, are never used on their own for coaching.
A model upgrade is a maintenance procedure, not a re-validation crisis, provided the maintenance is actually done. A frozen prompt on a new model degrades, and the completed prompt×model matrix (§4.7) shows the drift runs in both directions and is not proportional to how large the upgrade looks: B-iter19 fell from 80% to 72% run verbatim on Sonnet 5, while the Sonnet-5 champion run back on Sonnet 4.5 fell further, to 53%: a roughly 8-point penalty one way and a 24-point penalty the other on the reported ensembles (roughly 4 and 24 on a single-run basis; §4.7), across a single version step within one model family. The lesson is not that upgrades are dangerous; it is that a validated prompt cannot be assumed portable and every model version should be treated as unvalidated until the recalibration loop has re-anchored the prompt to the reference corpus and cold-validated it against the human panel. That loop is cheap: it restored and exceeded the baseline with three iterations and one accepted patch, then held up on three fresh 30-visit validation runs, and DeepSeek showed the same pattern across vendors (DS-iter44, §5.5). What an agency is buying is therefore not a frozen prompt. It is the rubric, the triple-graded reference corpus, and the calibration-and-validation procedure that re-anchors any capable model to that corpus. This also means no procurement lock-in to one vendor or model version.
For an agency considering deployment, the operational case is: a routine-grader deployment can score every recorded supervision visit at a small per-visit cost (open-weight models are the least expensive option, hosted closed models more, and frontier closed models the most; §5.5), recompute every total deterministically, and surface the small fraction of visits that warrant human spot-check. That expands coaching coverage from single-digit audit fractions to near-100% of the recording corpus, and it replaces the one staged, officer-knows-it’s-recorded visit per quarter or year with a census of ordinary visits (§3.2), so improvement shows up as a trend on real-world work rather than an inference from a single performance. The scores feed coaching, never personnel files (§9).
6.4 What this validates and what it does not
This validation establishes the relationship between the LLM grader and the expert human graders on rubric v1.0 across the 30-visit set. It does not establish that LLM-based coaching improves officer behavior on subsequent visits (an outcome question requiring a separate, longer study), that the tool works equally well across officer or participant demographic groups (a follow-on study requiring explicit demographic data), or that the results generalize beyond the agencies and populations sampled here. See Section 7.
One link in a chain, not the whole chain. The community corrections literature establishes that higher-fidelity supervision visits produce better participant outcomes (Labrecque et al., 2022; Chadwick et al., 2015). This paper does not re-establish that link, and it does not claim that grading visits improves outcomes on its own. It validates a prerequisite: that visit quality can be measured reliably and at scale. Whether that measurement, turned into coaching, improves officer practice and downstream outcomes is the subject of separate, ongoing work. Further studies complete the chain: a near-term coaching-quality study (can the model coach as well as a human?), an adjudication study (a consensus reference standard), and longer-term studies of whether coaching on these scores changes officer behavior and ultimately moves participant outcomes (§8). This paper is the measurement piece the other three depend on. We claim only that reliable measurement is a necessary first step, and we scope every result in this paper to that step.
The limitations and the deployment guardrails point at the same boundaries. The deployment guardrails are the limitations, restated as policy. The table below walks the intended use claim by claim, pairing each element of the deployment model with the specific finding that supports or bounds it.
Element of the deployment model                 Supporting or bounding finding
Trend coaching across many visits per officer   Random per-visit error (mean |Δ| vs the panel
                                                9.2 pp, roughly ±10 pp on a typical visit)
                                                averages out across an officer’s trend line, and
                                                the residual failure patterns are few and
                                                characterized case by case (§5.8). Run-to-run
                                                stability is 7.0–7.7 pp, versus 19.0 pp for the
                                                closest human pair (§5.1).
Flagging visits for coach attention             AUC 0.902 at the pool-median threshold (pick
                                                one stronger and one weaker visit at random
                                                and the ensemble ranks them correctly nine
                                                times in ten), with 93% sensitivity to
                                                at-or-above-median visits (14 of 15 caught;
                                                Figure 5a). A wrong flag costs a coach a second
                                                look, not anyone an adverse action (§5.4).
Spot-checkable rationales for supervisor        All 153 quoted evidence spans across the
review                                          champion’s three cold runs traced to the
                                                transcripts; zero fabricated quotations (quoted
                                                evidence only; §5.8). A human reviewer can
                                                audit any score against the cited spans.
Not single-visit judgments                      Single-run scores swung by tens of points on
                                                the corpus’s two unstable visits, and the
                                                acceptance-test pass count itself spread by
                                                four visits (20–24 of 30) across cold runs (§5.1,
                                                §5.3). The tool is not validated for one-off
                                                scoring of a single visit; deployment relies on
                                                ensembles, aggregation over time, and flag
                                                rules.
Not personnel decisions                         Panel-level human disagreement (three-rater α
                                                +0.199) caps the precision to which any grader,
                                                human or machine, can be validated on this
                                                instrument (§5.2, §7), and personnel use is
                                                excluded by design in the intended-use
                                                statement (§2).
Treatment Court visits                          The one subgroup where the model
                                                underperforms: 6/10 (60%) against the pooled
                                                77% (§5.6). Treatment Court visits are first in
                                                line for the human-review queue in any
                                                deployment.
7. Limitations
A 30-visit corpus. Every number in this paper comes from a 30-visit corpus drawn from multiple community corrections agencies and spanning three case types and three supervision levels. That spread across settings aids external validity at this scale, but 30 visits is still small: every confidence interval in Section 5 is as wide as n=30 makes it, and broader generalization (more visits and additional agencies) has not been demonstrated and is planned future work (Section 8).
We validate toward a variable human standard, not a ground truth, and the conventional α threshold does not govern that claim. The three-rater Krippendorff’s α on the weighted total is +0.199 (+0.462 for the two closer graders), with per-item α averaging +0.124. That figure sits below the +0.667 Krippendorff treats as a floor, but that threshold is a standard for treating coded data as reliable enough to stand in for the true value of a variable, a claim this study does not make. We do not assert that a single correct score exists; we measure whether the model falls within the real, documented spread of expert judgment as it occurs in the field, a spread that is itself a finding (§5.2). What the low α does bound is precision: a dispersed panel yields a wide band, so no grader, human or model, can be validated against it more sharply than the panel agrees with itself. Within that limit, three things place the model at the center of the panel rather than outside it: the average-measures reliability of the panel mean is moderate to good (ICC(2,3) = 0.582, ICC(3,3) = 0.788; §5.2); chance-corrected item agreement is substantial (Gwet’s AC1 +0.34 to +0.46, raw item agreement 65–73%; §5.2); and the laboratory-versus-field reliability gap is the norm for subjective expert coding, not a defect of this panel (the PCL-R falls from research ICCs of 0.86–0.94 to about 0.39 among opposing field evaluators; Murrie et al., 2013). A natural next step, set out in §8, is an adjudication study in which the graders confer to a consensus score per visit; that would furnish a tighter, agreed reference to measure the model against and turn the present agreement question into an accuracy one. What this paper reports is the more conservative test that comes first: performance against real human graders scoring independently in the field, variability and all.
One grader’s declines reduce her effective n to 25. One grader produced no defined weighted total on 5 of 30 visits (§4.4). The pool falls back to two graders on those visits, and every statistic involving that grader rests on 25 visits rather than 30.
The prompt was tuned on part of the same corpus. The champion prompt was adapted on a 12-visit development subset of the 30, so the full-corpus figure (23/30) is reported alongside the 18-visit holdout (16/18, 89%), which is the cleaner estimate of performance on visits the prompt never saw (§5.3). The corpus is also small enough that a simpler bounded-agreement check saturates; we therefore judge agreement with Formulation B and the distance matrix rather than that check (§4.6).
The Sonnet 5 re-adaptation loop was short, and its accept/reject decisions used single gradings. The loop ran three iterations and accepted one patch, with each candidate evaluated on one grading per development visit. Single gradings carry run-to-run noise (next item), so an accept or reject decision can be swayed by a lucky or unlucky run. Cold validation on three independent full-corpus runs mitigates this for the final champion but not for the intermediate decisions. A variance-aware acceptance rule is proposed in Section 8.
Single-run variance is material. The champion’s Formulation B pass count ranged from 20 to 24 of 30 across three cold runs, a four-visit spread around the ensemble figure of 23. Any single grading of a single visit carries this noise; deployment should rely on ensembles, aggregation over time, or flag rules rather than one-shot scores.
Cross-vendor results are single-run. The July 2026 champion-prompt sweep (§5.5) ran each model once per visit at temperature 0, while the champion is reported as a three-run ensemble; the champion’s own single-run Formulation B range is 20–24/30, so cross-vendor gaps smaller than ±2 visits are within single-run noise. Grok 4.3’s row covers only 24 of 30 visits at coarse Tier 3 granularity, and GPT-5.5’s covers 29 (one reproducible refusal). The coverage differences are themselves findings, but they also mean the n differs by row.
The validated prompt is withheld, so full replication is not currently possible. The artifact this paper validates, the S5-001 champion prompt, is proprietary and available by agreement rather than published (Appendix C). A third party can re-run the cached outputs and re-derive every number by recomputation, but cannot regenerate the model’s scores from scratch without the prompt, so independent replication of the exact grader is not currently possible. This is a deliberate trade-off, and it bounds the strength of external verification; we disclose it rather than let the by-agreement offer stand in for open replication.
Stated totals must never be used: a pipeline requirement. The LLM’s stated weighted totals drift from its own item-level marks by up to 13.3 pp, and human stated subtotals erred on 4, 7, and 17 of 30 visits across the three graders (§5.7). Any deployment of this grader must recompute tier and weighted totals mechanically from item-level marks. This is a hard requirement of the scoring pipeline, not an optional hygiene step.
Small subgroups. Case-type and supervision-level cells contain 10–15 visits each, so the subgroup results (§5.6) are directional, not precise. Treatment Court underperforms (60% vs 77% pooled); at n=10 this is four visits, all of them the corpus’s known-hard cases, and it is treated as a real gap warranting priority human review (§5.6).
Operational-parity, not outcome-linked, validation. This study answers whether the AI grader scores visits the way trained human auditors do. It does not answer whether using AI-generated coaching feedback actually improves officer behavior on subsequent visits, or whether participant outcomes change as a result. Outcome studies require a separate, longer design (Section 8).
Demographic subgroup analysis deferred. Officer and participant demographic identifiers were not part of the transcript metadata. The validation does not include analysis of whether the AI grader scores officers or visits with participants of different races, genders, or other demographic groups equally well. If this tool is ever to be used in a workflow that touches personnel decisions, a follow-on study with properly-consented officer self-identification data would be a prerequisite.
Rubric is the lens, not ground truth. “Agreement with expert human auditors using rubric v1.0” is not the same as “scores well-conducted visits highly.” The rubric is an explicit, auditable proxy for visit quality, defensibly anchored in published standards, but it is still a proxy, and items it does not measure are not measured. The wide human-human disagreement in Section 5.2, particularly on Tier 3 NA-handling, shows that even trained experts using the same rubric interpret some items differently. That is a feature of the domain, not a defect of the rubric, but one that bounds the precision of any agreement claim.
Single point in time. The numbers in this paper are tied to the specific model versions deployed at time of writing. Model behavior changes across versions (this study measured that directly, §4.7), so deployment requires version pinning plus the recalibration loop and re-validation whenever the version changes (§6.3).
8. Future work
Cross-vendor sweep on the champion prompt (completed 2026-07-04). The S5-001 champion prompt ran against GLM-5.2, MiniMax M3, DeepSeek V4 Flash, Gemini 3.5 Flash, Grok 4.3, and GPT-5.5, evaluated against the three-grader pool under Formulation B with recomputed totals; results are in Section 5.5. Remaining cross-vendor work: multi-run ensembles for the leading cross-vendor candidates.
Model-specific calibration at the cost frontier. The sweep surfaced its close-but-below candidate: GLM-5.2 (AUC 0.882, full coverage). The established next step is a short model-specific autoresearch loop: the pattern that took DeepSeek V4 Flash from 80% to 90% on the earlier test (DS-iter44).
Variance-aware autoresearch acceptance. The S5-001 loop accepted or rejected each candidate prompt on a single grading per development visit, exposing decisions to single-run noise (a 20–24 spread on the champion’s own pass count). Future loops should grade each candidate at least twice and decide on the mean, at roughly double the loop cost.
Larger, multi-agency corpus. Expanding the corpus with more visits and additional agencies is the most direct test of generalization; because the rubric is anchored in published national standards rather than any single agency’s manual, this is a tractable extension rather than a re-authoring exercise.
A fixed analysis plan for the expanded corpus. The next study defines its primary endpoint (Formulation B pass rate) and its fixed secondary-metric set before any grading begins, converting the acceptance-metric analysis from exploratory (this paper) to confirmatory and removing the researcher-degreesof-freedom concern that attends a metric chosen after seeing the data.
Grader-panel expansion and unscoreable-visit protocols. More graders stabilize the pool mean and the α estimates. Two protocol gaps surfaced by this study also need explicit rules: a resolution rule for visits a grader declares unscoreable (5 of 30 here), and a corpus-inclusion rule for collateral contacts (the visit-113 question). Both would improve human and automated grading equally.
An adjudicated consensus standard. The sharpest limitation of this design is the absence of an external accuracy criterion: the model is measured against a panel whose members disagree, not against a known true score (§7). A consensus study would convene the three expert graders to review each transcript together and negotiate a single agreed score per visit, yielding an adjudicated reference that is better grounded than any individual grader or the pool mean. That reference would let the grader prompt be calibrated and validated toward a defensible target rather than the center of a dispersed panel, turning the agreement question of this paper into an accuracy question.
Intra-rater (test-retest) study for the human graders. Each grader re-grades a stratified subset of her own visits at least 30 days later, producing the human self-agreement floor. The LLM’s equivalent is measured (7.0–7.7 pp run-to-run; §5.1); the humans’ is unknown, and it is the fairest yardstick for how much run-to-run LLM variance a deployment should tolerate. No grader, human or model, should be expected to agree with a colleague better than she agrees with herself.
Coaching-quality study (near-term, underway). Can the model turn its visit scores into coaching as well as a human coach can? Expert graders score the model’s coaching output against human-authored coaching on the same visits, and the study validates a method for coaching cadence and content. It tests parity on the coaching itself, not yet its downstream effect on practice. This study is underway, with results expected shortly after this paper.
Outcome-linked coaching study (longer-term). Does coaching against AI-generated visit scores actually change officer behavior on subsequent visits, and does that translate into participant outcomes? This requires a longer-horizon design (12–18 months) with matched cohorts and outcome-data access, and is the strongest empirical claim RePath Labs could eventually make. This paper establishes the measurement prerequisite; the coaching-quality study above is the step between.
v2: AI-conducted visits via phone app, non-inferiority study. A follow-on study testing whether visits conducted (not just graded) by an AI score as well as human-conducted visits on the same rubric. Uses this paper’s rubric and grading pipeline directly; the triple-graded 30-visit distribution becomes the empirical baseline (expanded as more transcripts are graded). Includes deliberate red-teaming for crisis scenarios, hostile or manipulative participants, language-barrier scenarios, and other safety-critical edge cases.
Continuous re-validation. Quarterly re-validation of the deployed grader against a rolling visit sample to detect agreement drift, plus a full recalibration-loop pass (§4.7) whenever the deployed model version changes. The B-iter19 →S5-001 episode is the template: assume agreement is stale, re-run the loop, cold-validate before switching.
9. Responsible use
This is a measurement study, not a deployment manual. We make three recommendations.
Adopt an AI grader only where it has been validated against an expert human panel, with the analysis approach fixed and disclosed, as it is here, and re-validated whenever the model version changes (§4.7). External adoption frameworks for AI in criminal justice make the same recommendation (Council on Criminal Justice, 2026; Urban Institute, 2026).
Treat this validation as a floor. Two further studies would strengthen it before wide reliance: an adjudication study that establishes an accuracy criterion beyond inter-rater agreement (§7), and a validation of the coaching method the scores feed, with expert human graders scoring the coaching output and a validated method for coaching cadence and content. Both the adjudication study and the coaching work are the subjects of upcoming papers.
Use the tool for what it was validated to do: improving the quality of supervision visits and the outcomes that follow. Scores are for coaching. They are not a basis for hiring, firing, promotion, discipline, or any other personnel decision, and using them that way goes beyond what this validation supports.
Competing interests and funding
This study was designed, conducted, and funded by RePath Labs (eHawk Solutions), which develops the AI grading tool evaluated here; the authors have a commercial interest in the outcome. Valerie Meade participated as an independent consultant. As disclosed in §4.4 and the Author contributions, she co-designed the rubric and study and served as one of three expert graders, but was blinded to the other graders’ scores and took no part in the analysis comparing graders or comparing the model to the human pool. No external or public funding supported the work. We have tried to mitigate these conflicts through transparent reporting, recomputation of every score from item-level marks, evaluation against the full expert panel rather than any single grader, and by scoping the claims to measurement rather than outcomes. As a sensitivity check, re-running the headline against the two-grader pool that excludes Meade (Maureen Flanagan and Katie Myers only) leaves the model closer to that pool than the two graders are to each other (mean |Δ| 11.5 pp versus a 33.3 pp pairwise human distance; Pearson r +0.723), so the result does not depend on her scores.
Data and ethics. The transcripts are recordings of real supervision visits used for this research under RePath’s existing agency contracts. All were de-identified before grading, with participant and officer identifiers removed, and the human graders reviewed only de-identified text. The three expert graders were compensated for their time, scored blind to one another, and consented to be named.
Author contributions
Ted Green (RePath Labs) led the study: its conception and design, the grading and analysis pipeline, the data analysis, and the writing. Madeline Warren (RePath Labs) helped conceive and organize the study, co-drafted the rubric, oversaw data integrity, processed and re-checked the data, and contributed to editing the paper. Valerie Meade (independent consultant) helped conceive and design the study, co-drafted the rubric, served as one of three independent expert graders, and contributed to editing the paper. To keep the human reference standard independent of her design role, Valerie was blinded to the other graders’ scores and had no part in the analysis comparing graders or comparing the model to the human pool; the rubric was frozen before any grading and is built on published national standards (§4.3, §4.4). Maureen Flanagan and Katie Myers each served as an independent expert grader. All authors reviewed and approved the final paper and are accountable for it.
The three expert graders are named with their consent.
Acknowledgements
The authors thank the three expert graders, Valerie Meade, Maureen Flanagan, and Katie Myers, for their careful and independent scoring of the corpus.
References
- American Probation and Parole Association (n.d.). National Standards for Community Corrections. https://www.appa-net.org/eweb/docs/APPA/APPAs_National_Standards_for_Community_Corrections.pdf
- Bonta, J. et al. (2021). A system-wide implementation and evaluation of the Strategic Training Initiative in Community Supervision (STICS). Journal of Criminal Justice, 74, 101816.
- Chadwick, N., DeWolf, A., & Serin, R. (2015). Effectively training community supervision officers: A meta-analytic review of the impact on offender outcome. Criminal Justice and Behavior, 42(10), 977– 989.
- Council on Criminal Justice (2026). Assessing AI for Criminal Justice: A User Decision Framework.
- Dunivin, Z. O. (2025). Scaling hermeneutics: a guide to qualitative coding with LLMs for reflexive content analysis. EPJ Data Science 14:28.
- Gwet, K. L. (2014). Handbook of Inter-Rater Reliability (4th ed.). Advanced Analytics. (Gwet’s AC1, robust to the prevalence/marginal paradox that deflates κ and α.)
- Hosmer, D. W., Lemeshow, S., & Sturdivant, R. X. (2013). Applied Logistic Regression (3rd ed.). Wiley. (Source of the AUC discrimination bands used in §5.4.)
- Hu et al. (2025). Toward expert-level motivational interviewing for health behavior improvement with LLMs. arXiv:2512.15446.
- Koo, T. K., & Li, M. Y. (2016). A Guideline of Selecting and Reporting Intraclass Correlation Coefficients for Reliability Research. Journal of Chiropractic Medicine, 15(2), 155–163.
- Krippendorff, K. (2018). Content Analysis: An Introduction to Its Methodology. (4th ed.). SAGE.
- Labrecque, R. M., Viglione, J., & Caudy, M. (2022). The Impact of Community Supervision Officer Training Programs on Officer and Client Outcomes: A Systematic Review and Meta-Analysis. Justice Quarterly, 40(4), 587–611. DOI: 10.1080/07418825.2022.2120062.
- Lowenkamp, C. et al. (2013). EPICS: Effective Practices in Community Supervision, second-year update. University of Cincinnati Corrections Institute.
- Moyers, T. B., et al. (2016). The Motivational Interviewing Treatment Integrity Code (MITI 4): Rationale, preliminary reliability and validity. Journal of Substance Abuse Treatment, 65, 36–42.
- Murrie, D. C., Boccaccini, M. T., Guarnera, L. A., & Rufino, K. A. (2013). Are forensic experts biased by the side that retained them? Psychological Science, 24(10), 1889–1897. (Field reliability of the PCL-R falls to roughly ICC 0.39 among opposing evaluators, versus 0.86–0.94 in research settings.)
- OpenAI (2025). HealthBench: Evaluating Large Language Models Toward Improved Human Health.
- OpenAI (2026). HealthBench Professional: Evaluating Large Language Models on Real Clinician Chats.
- Portela, C., Castillo, C., Tolan, S., Karimi-Haghighi, B., & Andrés Pueyo, A. (2024). A comparative user study of human predictions in algorithm-supported recidivism risk assessment. Artificial Intelligence and Law, 33, 471–517.
- Urban Institute (2026). Responsible AI Adaptation in Corrections.
Appendices
Appendix A: Rubric v1.0 (item inventory and scoring)
The Supervision Quality Fidelity Rubric 2.0 comprises 43 binary items across three weighted tiers. Each item is scored Yes (behavior demonstrated), No (an opportunity was present but the behavior was not demonstrated), or NA (no opportunity to demonstrate). A tier score is the proportion of demonstrated items among the scored (non-NA) items: tier % = #Yes / (#Yes + #No). The visit weighted total is Tier 1 × 0.20 + Tier 2 × 0.30 + Tier 3 × 0.50. The rubric is authored from published national standards (Core Correctional Practices, APPA standards, and the Risk-Need-Responsivity literature); it is not derived from any single agency’s manual (§4.3). Full item wording, behavioral definitions, and NA rules are contained in the content-hashed rubric document distributed with the verification package (Appendix E). The complete item inventory follows.
Tier 1: Foundations (weight 0.20; 5 items). T1.1 Stated Purpose; T1.2 Goals Referenced; T1.3 Goal Collaboration; T1.4 Conditions Reviewed; T1.5 Next Appointment Confirmed.
Tier 2: Structure (weight 0.30; 7 items). T2.1 Rapport Building; T2.2 Review of Previous Goals; T2.3 Intervention Delivered; T2.4 Next Steps Assigned; T2.5 Criminogenic Need Addressed; T2.6 Reinforcement Ratio 4:1; T2.7 Motivational Interviewing.
Tier 3: Core Correctional Practice Execution (weight 0.50; 31 sub-items across 9 skills).
- Skill 1, Effective use of authority: T3.1.1 Firm but fair; T3.1.2 Rules and consequences; T3.1.3 Prosocial opportunities and rewards.
- Skill 2, Prosocial modeling: T3.2.1 Officer demonstrates prosocial behavior; T3.2.2 Names behavior modeled; T3.2.3 Invites client to try behavior.
- Skill 3, Effective reinforcement: T3.3.1 Identify behavior reinforced; T3.3.2 Verbal praise linked to behavior; T3.3.3 Client identifies benefits.
- Skill 4, Effective disapproval: T3.4.1 Identify behavior disapproved and explain; T3.4.2 Client identifies consequences; T3.4.3 Client identifies prosocial alternative.
- Skill 5, Problem solving: T3.5.1 Define problem behaviorally; T3.5.2 Generate two or more options; T3.5.3 Weigh pros and cons; T3.5.4 Commit to a next step.
- Skill 6, Role clarification: T3.6.1 Purpose and rules of supervision; T3.6.2 Officer role expectations; T3.6.3 Client role expectations.
- Skill 7, Cognitive restructuring: T3.7.1 Identify thought tied to risk; T3.7.2 Examine the thought (evidence); T3.7.3 Generate an alternative thought; T3.7.4 Plan to use the alternative.
- Skill 8, Active listening: T3.8.1 Pay attention / avoid distractions; T3.8.2 Show listening through verbal cues; T3.8.3 Reflect, question, summarize; T3.8.4 Defer judgment.
- Skill 9, Giving feedback: T3.9.1 Decide information to give; T3.9.2 Ask permission to offer feedback; T3.9.3 Calmly offer feedback; T3.9.4 Thank for listening.
Appendix B: Per‐item and per‐grader agreement
Per-item nominal Krippendorff’s α (Yes/No, NA treated as missing) across the three graders, with the three-way exact-agreement count among the visits all three scored Yes/No. Tier means: T1 +0.04, T2 +0.25, T3 +0.11. As discussed in §5.2, these chance-corrected per-item values are depressed by skewed item margins; the more faithful summaries for a binary instrument are raw item agreement (65–73%) and Gwet’s AC1 (+0.335 three-grader mean; +0.460 for the Grader 1–Grader 2 pair). Several items rest on very few jointly-scored visits (the 3-way count in the last column); per-item α is uninterpretable at those denominators (for example T3.9.1 rests on a single visit) and those rows are shown only for completeness.
Item                                         Tier   α (Yes/No)   3-way agree
T1.1 Stated Purpose                          T1     +0.03        13/26
T1.2 Goals Referenced                        T1     +0.02        6/26
T1.3 Goal Collaboration                      T1     +0.10        6/25
T1.4 Conditions Reviewed                     T1     -0.17        3/25
T1.5 Next Appointment Confirmed              T1     +0.24        13/27
T2.1 Rapport Building                        T2     +0.36        12/21
T2.2 Review of Previous Goals                T2     -0.03        8/22
T2.3 Intervention Delivered                  T2     +0.45        16/19
T2.4 Next Steps Assigned                     T2     +0.10        5/24
T2.5 Criminogenic Need Addressed             T2     +0.23        11/24
T2.6 Reinforcement Ratio 4:1                 T2     +0.24        16/26
T2.7 Motivational Interviewing               T2     +0.37        16/26
T3.1.1 Firm but fair                         T3     -0.12        2/12
T3.1.2 Rules and consequences                T3     +0.24        3/11
T3.1.3 Prosocial opportunities and rewards   T3     +0.25        6/11
Item                                             Tier   α (Yes/No)   3-way agree
T3.2.1 Officer demonstrates prosocial behavior   T3     -0.05        0/6
T3.2.2 Names behavior modeled                    T3     +0.35        5/6
T3.2.3 Invites client to try behavior            T3     +0.26        5/6
T3.3.1 Identify behavior being reinforced        T3     -0.08        3/16
T3.3.2 Verbal praise linked to behavior          T3     +0.06        5/16
T3.3.3 Client identifies benefits                T3     +0.21        11/16
T3.4.1 Identify behavior disapproved + explain   T3     +0.29        2/6
T3.4.2 Client identifies consequences            T3     +0.62        5/6
T3.4.3 Client identifies prosocial alternative   T3     -0.00        4/6
T3.5.1 Define problem behaviorally               T3     -0.10        1/3
T3.5.2 Generate 2+ options                       T3     -0.01        0/3
T3.5.3 Weigh pros/cons                           T3     +0.48        2/3
T3.5.4 Commit to next step                       T3     -0.09        0/3
T3.6.1 Purpose/rules of supervision              T3     +0.31        0/5
T3.6.2 Officer role expectations                 T3     -0.23        0/5
T3.6.3 Client role expectations                  T3     +0.19        0/5
T3.7.1 Identify thought tied to risk             T3     +0.32        2/7
T3.7.2 Examine thought (evidence)                T3     +0.32        2/7
T3.7.3 Generate alternative thought              T3     -0.03        4/6
T3.7.4 Plan to use alternative                   T3     -0.05        4/6
T3.8.1 Pay attention / avoid distractions        T3     -0.03        17/24
T3.8.2 Show listening through verbal cues        T3     -0.05        20/23
T3.8.3 Reflect/question/summarize                T3     +0.19        8/24
T3.8.4 Defer judgment                            T3     +0.50        17/22
T3.9.1 Decide information to give                T3     -0.33        0/1
T3.9.2 Ask permission to offer feedback          T3     -0.19        1/2
T3.9.3 Calmly offer feedback                     T3     -0.25        0/2
T3.9.4 Thank for listening                       T3     +0.41        1/2
Pairwise human agreement (item level, Yes/No): Grader 1–Grader 2 72.9% (AC1 +0.460); Grader 1– Grader 3 57.5% (AC1 +0.178); Grader 2–Grader 3 65.9% (AC1 +0.368). LLM–human item agreement (champion ensemble): Grader 1 71.5% (macro-F1 0.713); Grader 2 70.1% (0.696); Grader 3 62.1% (0.570); against the human majority 75.0% (macro-F1 0.736). Full detail in the verification package (Appendix E).
Appendix C: Champion grader prompt
The v1.0 headline grader is the S5-001 champion prompt: an autoresearched descendant of the earlier B-iter19 prompt, adapted for Claude Sonnet 5, with one accepted patch (the Visit Substance Gate and functional-credit standard). Its construction, guardrails, and cold-validation are described in §4.7; the prior baseline is B-iter19 on Sonnet 4.5.
The verbatim champion prompt is proprietary and is not reproduced here. The full prompt may be made available to interested parties by agreement. Disclosing the calibration procedure (§4.7) and the rubric (Appendix A), rather than the frozen prompt string, is a deliberate choice: the procedure (a guard-railed patch search plus cold-run validation against the human panel) is what an agency relies on when the model or panel changes, and it is what this paper validates. Every number in §5 is reproducible from the cached grading outputs and analysis scripts in the verification package (Appendix E) without the prompt text.
Appendix D: Length‐adjustment check
A common concern with LLM graders is that they reward verbosity, scoring longer visits higher simply because there is more text to credit. We tested this directly on the 30-visit corpus. Visit duration correlates with the champion ensemble’s weighted total at r = +0.50 and with the human pool mean at r = +0.42: longer visits do score higher, for the humans and the model alike, which is expected because longer visits generally contain more supervision work. The test for a verbosity bias specific to the model is whether the model’s departure from the human pool depends on length. It does not. Regressing the LLM-minus-pool residual on visit duration gives a slope of +0.08 percentage points per minute (95% CI −0.21 to +0.36; r = +0.10), statistically indistinguishable from zero. Using transcript byte length in place of duration gives the same conclusion (residual–length r = +0.17). Because the residual shows no meaningful length dependence, no length adjustment was applied; the raw and length-adjusted headline numbers are equivalent within this uncertainty.
Appendix E: Verification package
This appendix describes the verification package that supports the numbers in this paper. RePath Labs maintains this package; it is not published openly, but the package described below may be made available to interested parties by agreement. Two items are excluded from any such sharing: the proprietary grader prompt (Appendix C) and the PII-bearing transcripts (see E.2).
E.1 What is included
Artifact                                    Purpose
Rubric v1.0 (content-hashed)                The Supervision Quality Fidelity Rubric 2.0: 43
                                            items, definitions, scoring and NA rules
                                            (Appendix A).
Recomputed grader scores                    All three expert graders’ item-level Yes/No/NA
                                            marks and recomputed tier and weighted
                                            totals.
Champion LLM gradings                       The Sonnet 5 champion (S5-001) three
                                            cold-run per-visit outputs, item-level.
Baseline and cross-vendor gradings          Sonnet 4.5 B-iter19 runs, the Sonnet 4.5
                                            pairing-cell run, and the July 2026
                                            cross-vendor sweep outputs (GLM-5.2,
                                            MiniMax M3, DeepSeek V4 Flash, Gemini 3.5
                                            Flash, GPT-5.5, Grok 4.3).
Visit metadata + transcript hash manifest   Supervision level, duration, and case type, plus
                                            the SHA-256 hash of each of the 30 transcripts.
Artifact           Purpose
Analysis scripts   Recompute-from-item-marks, full-30
                   evaluation (Formulation B, mean |Δ|, Pearson r,
                   Spearman ρ, AUC), item agreement and Gwet’s
                   AC1, subgroups, and the length check.
Run and cost log   Per-call cost, latency, and token usage for the
                   API and OpenRouter runs.
E.2 What is not included, and why
- The transcripts. The 30 visit recordings contain personal information and are not published. They are referenced by SHA-256 hash only, so a holder of the corpus can confirm exact file identity, and any change to a transcript invalidates its score binding.
- The verbatim champion prompt. It is proprietary (Appendix C). The calibration procedure (§4.7) and the rubric (Appendix A) are disclosed instead, and every §5 number is reproducible from the cached grading outputs without it.
E.3 Model versions
Role                                          Model
Headline grader (Sonnet 5 champion, S5-001)   Claude Sonnet 5 (via Cowork sub-agents;
                                              temperature 0, three independent cold runs)
Prior baseline and Sonnet 4.5 pairing cell    Claude Sonnet 4.5
                                              (claude-sonnet-4-5-20250929)
Cross-vendor sweep (July 2026, via            GLM-5.2, MiniMax M3, DeepSeek V4 Flash,
OpenRouter, temperature 0)                    Gemini 3.5 Flash, GPT-5.5, Grok 4.3 (exact
                                              returned version tags in the run log)
E.4 Reproducing the numbers
All totals are recomputed from item-level marks (§4.6); stated subtotals are never used. The package’s recompute-from-item-marks and full-30 evaluation scripts recompute tier and weighted totals from item marks and compute Formulation B, mean |Δ|, Pearson r, Spearman ρ, and AUC against the three-grader pool. Both operate entirely on the per-visit JSON outputs and make no API calls, so every headline number in §5 can be reproduced from the package without re-running any model. Re-running the models themselves additionally requires the proprietary prompt (available by agreement) and access to the hash-verified transcripts.