Plain-language summary
The short version
The question. Does the share of scheduled app check-ins a participant completes in the first 30 days of pretrial supervision say anything about how the case ends?
What we did. We looked at every Missouri pretrial case on RePath that closed successfully or unsuccessfully between October 1, 2025, and September 30, 2026, and was open at least 30 days: 4,833 closures across 65 agencies. For the 1,504 cases with check-ins scheduled in the first month, we compared first-month completion between cases that closed successfully and cases that did not, then tested the result by case length, agency, excluded closures, other definitions of month one and agency batch closing. Every figure is an aggregate computed inside RePath's data warehouse, and no participant-level record left it.
What we found.
- Participants whose cases closed successfully had completed 68.9% of their first-month check-ins, against 47.3% for those whose cases closed unsuccessfully: a gap of 21.6 points (95% CI 17.2 to 26.0).
- People who completed fewer than half closed unsuccessfully 32.9% of the time, against 14.2% for everyone else (risk ratio 2.31).
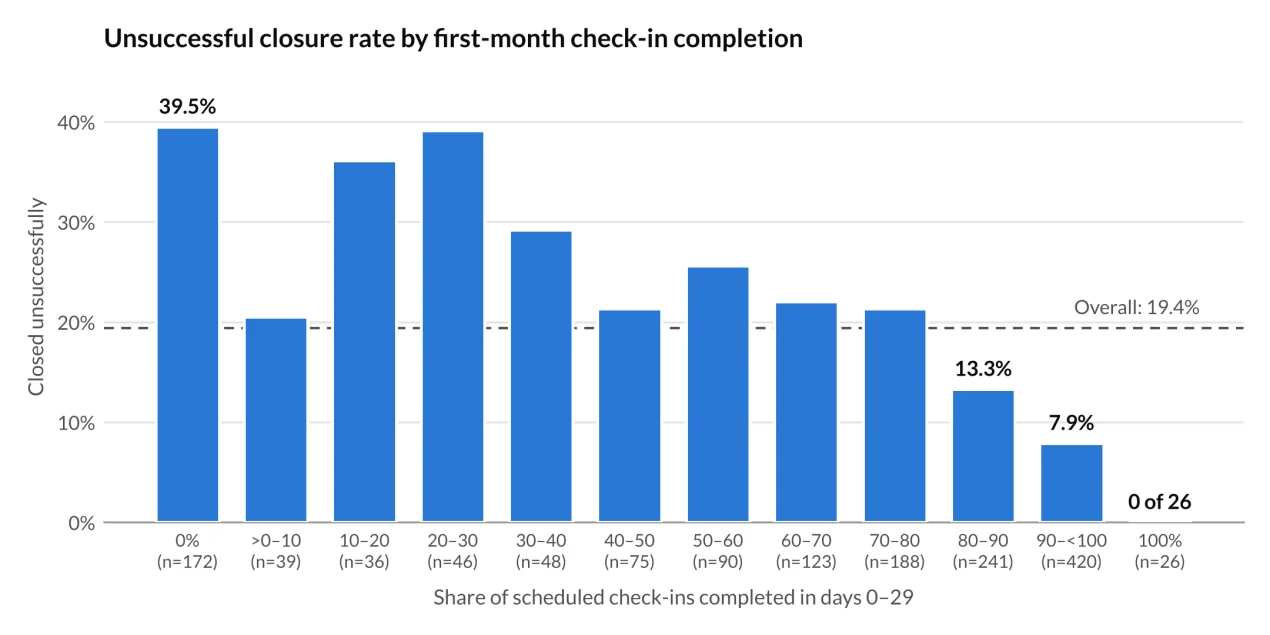
- Overall, unsuccessful closure fell as completion rose: 39.5% for people who completed none, 7.9% at 90 to 99%, and none of the 26 people who completed every check-in.
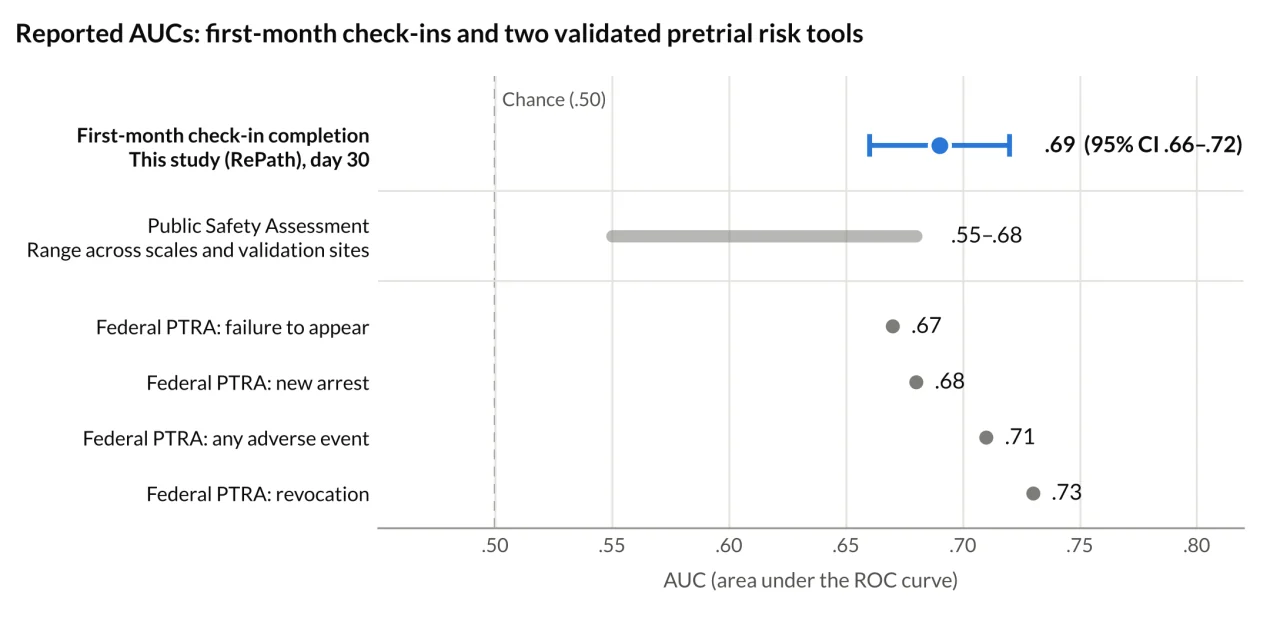
- First-month completion separated the two outcomes with an AUC of .69 (95% CI .66 to .72), within the range reported for validated pretrial risk tools (Public Safety Assessment .55 to .68; federal Pretrial Risk Assessment .67 to .73). Populations, outcomes and timing differ, so this is not a direct comparison.
- The gap held across minimum case lengths, inside all nine agencies large enough to test alone, with excluded closures recoded either way, and without closures recorded on agency batch days (18.4 points).
Why it matters. Check-in completion comes out of supervision that is already happening, with no new assessment, interview or scoring. From the fifth week it gives officers an early, consistent reason to reach out while there is still time to fix a problem, such as a phone that does not work or a schedule that does not fit. It is an early indicator, not a risk assessment.
Limits. Descriptive and observational: an association, not a cause, and no response to low completion was tested. One state over one year. Outcomes are as agency staff recorded them, and new arrests, failures to appear and technical revocations cannot be told apart. Covers only cases with check-ins scheduled, mostly at the high supervision level. The data warehouse had no independent data quality layer yet, and RePath Labs studied data from its own product.
Full text
Version 1.0, October 2026. Plain-text rendering of the paper for reading and search. Figures and tables are reproduced from the PDF; if anything here differs from the PDF, the PDF is the version of record.
Working paper (RePath Labs). Not peer reviewed. This is a preprint we're sharing for comment. It hasn't been through journal peer review, so the findings and framing may change in later versions.
License: © 2026 RePath Labs. All rights reserved.
Materials availability. Appendix A lays out the query filter and how each measure is defined. The saved SQL, the aggregate output files and the completion band table can be shared with interested parties by agreement. No participant level record left the data warehouse during this study, and none is shared.
Scope. The indicator is meant to give agencies, and others involved in pretrial cases, consistent information early in supervision that they can act on. It isn't a risk assessment and doesn't replace one.
Correspondence: Ted Green, Director, RePath Labs (tedgreen@ehawksolutions.com).
ORCID iD: Cliff Johnston 0009-0001-2039-0072.
Suggested citation. Johnston, C., & Green, T. (2026). Mobile check-in completion as an early indicator of case outcomes in pretrial supervision: A descriptive study of check-ins completed in the first 30 days and successful case closure across 65 Missouri pretrial agencies. RePath Labs working paper, version 1.0.
Abstract
Pretrial supervision has a short window to keep someone on track to resolve their case without going back to jail, and most of what agencies use to decide how closely to supervise a person is set at booking. Published pretrial research has found that static factors like criminal history and prior failures to appear predict better than dynamic ones (Bechtel, Lowenkamp, & Holsinger, 2011), and what we found may challenge that. We wanted to know whether one thing RePath records from day one, the share of scheduled app check-ins a participant completes in their first 30 days, says anything about how the case ends. We looked at Missouri pretrial cases that closed successfully or unsuccessfully between October 1, 2025, and September 30, 2026, and were open at least 30 days (4,833 closures across 65 agencies). Of those, 1,504 cases had check-ins scheduled in the first month. Participants whose cases closed successfully had completed 68.9% of them, and participants whose cases closed unsuccessfully had completed 47.3%, a gap of 21.6 points (95% CI 17.2 to 26.0; Cohen's d = 0.67). People who completed fewer than half closed unsuccessfully 32.9% of the time, compared with 14.2% for everyone else (risk ratio 2.31). Unsuccessful closure was most common among people who completed little or none of their first month check-ins (39.5% at zero) and least common among those who completed nearly all of them (7.9% at 90 to 99%; none of 26 at 100%). Completion in the first month separated the two outcomes with an AUC of .69 (95% CI .66 to .72). That's within the range reported for two validated pretrial risk tools, the Public Safety Assessment (.55 to .68) and the federal Pretrial Risk Assessment (.67 to .73), though the populations, outcomes and timing aren't the same. The gap held up across minimum case lengths, inside individual agencies, with excluded closures recoded either way, and after dropping closures recorded on agency batch days. The study has real limits. It's one state over one year, the outcomes are whatever agency staff entered, technical revocations and new arrests can't be told apart, and the data warehouse didn't have its own quality checks yet when we ran the analysis. With those limits in mind, check-in completion in the first month works as an early indicator that gives agencies something useful to act on, and it doesn't add any new assessment.
1. Executive summary
Why this study matters. Pretrial is an early point where supervision can help keep a person out of the cycle of arrest, detention, conviction and return, and for a lot of people it comes up more than once. Most people who end up in prison have been through the system many times. People admitted to state prison in 2014 had a median of nine prior arrests, counting the one that sent them there (Durose & Antenangeli, 2023), and probation and parole violations made up 45% of state prison admissions in 2017 (Council of State Governments Justice Center, 2019). Plenty of pretrial defendants are already in that cycle. Three in four felony defendants in the nation's 75 largest counties had a prior arrest (Reaves, 2013). So every pretrial case is a chance to catch trouble early. In this study almost every unsuccessful closure was recorded as a return to jail or a technical revocation, which is why knowing early who's heading that way matters to the participant, their family, the agency and the community.
Most of what agencies use to decide how much attention a case needs is set at booking, things like the charge, the person's history or a risk score. Those tools are useful, but they don't change once supervision starts. RePath records something else from the first day, which is what the participant does. This paper asks whether the first month of that record tells an officer anything about how the case will end.
Study design. We pulled every Missouri pretrial case on a RePath program that closed successfully or unsuccessfully between October 1, 2025, and September 30, 2026, and had been open at least 30 days. That's 4,833 closures across 65 agencies. A check-in is a random alert, set up in RePath the way the agency wants it. It asks the participant to take a selfie in the RePath mobile app, and the system uses facial recognition to confirm who they are and sends the result to the officer (§4.2). For each case we worked out check-in completion for the first month, which is the number of check-ins completed divided by the number scheduled, added up over days 0 to 29 from the start of supervision. Check-ins are mostly scheduled for medium and high level participants, so 1,504 cases had the measure. The rest are reported on their own and kept out of every rate. We compared completion between cases that closed successfully and cases that didn't, looked at the unsuccessful closure rate across 12 completion bands, and tested the result against case length, agency, excluded closures, other ways of defining month one, and agency batch closing. Every figure is an aggregate computed inside RePath's data warehouse, and no participant level record left it.
Main finding. In this paper a case ends well when the agency records the closure as Successful, and it ends badly when the agency records it as Unsuccessful. In these data almost every unsuccessful closure is recorded as a return to jail or a technical revocation. Check-in completion in the first month separates the two groups from the fifth week of supervision, and how well it does so is in the range reported for validated pretrial risk tools (Figure 2; §5.3 explains why that isn't a direct comparison). Participants whose cases ended well had completed 68.9% of their first month check-ins, and those whose cases ended badly had completed 47.3%, a gap of 21.6 points. Overall the pattern goes one way. The unsuccessful closure rate is highest for participants who completed little or none of their first month check-ins (39.5% at zero), stays near the average through the middle bands, and drops sharply for those who completed nearly all of them, down to 7.9% at 90 to 99%. None of the 26 participants who completed every check-in closed unsuccessfully (Figure 1).
The numbers worth remembering.
- A 21.6 point gap in the first month. On average, participants whose cases ended well completed 68.9% of the check-ins scheduled in their first 30 days, and participants whose cases ended badly completed 47.3%. That's a difference of 21.6 percentage points (95% CI 17.2 to 26.0; n = 1,212 and 292; d = 0.67).
- 2.3 times the rate of unsuccessful closure. Among participants who completed fewer than half of their first month check-ins, 32.9% of cases ended badly (n = 416). Among those who completed half or more, 14.2% did (n = 1,088). The first rate is 2.31 times the second (95% CI 1.89 to 2.82).
- Unsuccessful closure falls as completion rises. The share of cases that ended badly was 39.5% for participants who completed none of their first month check-ins, 13.3% for those who completed 80 to 89%, 7.9% at 90 to 99%, and 0 of 26 for those who completed all of them.
- AUC .69 (95% CI .66 to .72). Check-in completion in the first month separated cases that ended well from cases that ended badly with an AUC of .69. Published validations report AUCs of .55 to .68 for the Public Safety Assessment and .67 to .73 for the federal Pretrial Risk Assessment (Figure 2). Section 5.3 covers why the two can't be compared directly.
- Nonusers don't explain it. Participants who completed none of their first month check-ins make up 23.3% of the cases that ended badly and 8.6% of the cases that ended well. Take them out and the gap is 13.7 points, and the share ending badly still falls as completion goes up.
- It holds up under checks. The gap is 18.1 points among cases open six months or more, so it isn't coming from short cases. It's positive in all nine agencies big enough to test on their own, and it's 19.9 points without the largest agency. It stays between 18.3 and 19.5 points whether excluded closures are counted as successful or unsuccessful, and it's 18.4 points without closures recorded on agency batch days. It was positive in every quarter of the year.
What this is for. It gives an agency early information it can do something with. An officer has a reason to reach out to a participant in week five instead of month four, while there's still time to fix the problem, whether that's a phone that doesn't work, a schedule that doesn't fit, or confusion about what's expected. It also gives others in the pretrial process, judges included, the same view of how each participant's first month went.
What this is not for. It isn't a substitute for a pretrial risk assessment or for the judgment of officers and judges. This study doesn't show that raising check-in completion improves outcomes, and it doesn't test any particular response.
How to read this paper. Sections 1 to 3 and 6 to 8 are written for readers without a technical background. Sections 4 and 5 and Appendix A cover the methods, statistics and full disclosures for technical reviewers. Section 4.5 explains each statistic in plain language.
2. Scope and intended use
The measure is meant to give agencies timely information they can act on, and how they act on it is up to them. It comes out of supervision that's already happening. There's no extra assessment, interview or scoring. Once check-ins are scheduled, RePath records whether each one gets done, and the completion share for the first month can be worked out from the fifth week of supervision.
Intended uses. The indicator can give officers an early, consistent view of which participants had a rough first month. It can give supervisors, agencies and others in the pretrial process, judges included, the same information about how engaged participants were in that first month. Agencies can also use it to improve their own practice, for example by checking whether participants with low completion run into the same barriers, like access to a device.
Uses it isn't meant for. The indicator isn't a risk assessment and shouldn't be used in place of one.
The population this finding covers. It covers cases with app check-ins scheduled in the first month. In the agencies we studied, those are almost all medium and high level cases. It says nothing about participants who aren't scheduled check-ins, and most of them are supervised at the low level.
3. Background
3.1 What predicts pretrial failure
Pretrial risk assessment has mostly been built on information that's available at booking. In a widely cited meta-analysis of pretrial failure, Bechtel, Lowenkamp, and Holsinger (2011) pooled 13 studies and found that static predictors carried more of the signal than dynamic ones. For new criminal activity, the average correlation was .15 for static factors and .05 for dynamic factors. The leading pretrial tools follow that design. The Public Safety Assessment (PSA) scores nine factors drawn from age, the current charge and criminal history using administrative data, and its validations report AUCs from .55 to .68 depending on the scale and jurisdiction (Advancing Pretrial Policy & Research, 2021). The federal Pretrial Risk Assessment (PTRA), revalidated on 85,369 released defendants, reports AUCs of .67 for failure to appear, .68 for new arrest, .71 for any adverse event and .73 for revocation (Cohen, Lowenkamp, & Hicks, 2018).
These tools are scored once, at or before release. They tell an agency how much attention a case might need, but they don't change when a participant's behavior does.
3.2 Behavior during supervision as a signal
Less research looks at what happens after release. The closest earlier work to this study is more than 25 years old. In the Philadelphia pretrial release supervision experiments, defendants who missed their first pretrial services orientation had higher rates of failure to appear (30% vs. 9%) and rearrest (11% vs. 4%) over the next 30 days, and whether people kept their supervision meetings was significantly related to both outcomes (Goldkamp & White, 1998). Telephone reporting compliance in that study peaked at 61% in the first week and fell to 19% by week 16. Drug court research shows a similar early pattern. Among New South Wales drug court participants, 8.5% of those who missed no appointments in their first three months reoffended in months four to six, compared with 40% of those who missed one or two (Freeman & Donnelly, 2005). In federal supervision after conviction, changes in reassessed risk predicted recidivism beyond the initial score (Cohen, Lowenkamp, & VanBenschoten, 2016).
The evidence isn't all one way. In a sample of 320 felony defendants on bond supervision, each extra technical violation raised the odds of bond revocation (OR 1.42), but failing to report had no detectable effect (OR 0.98; Zettler & Martin, 2022). Recorded reporting violations and a running completion share measure different things, and one small sample doesn't settle it. Still, it's a reminder that not every compliance measure predicts outcomes.
As far as we know, no published study has tested whether completing remote (smartphone) check-ins in the first 30 days of pretrial supervision is an early sign of how a case closes. This paper does.
3.3 Predictive is not causal
Something can predict an outcome without causing it. A well known example comes from medicine. In the Coronary Drug Project, participants who reliably took their placebo had much lower five year mortality than those who didn't (15.1% vs. 28.3%; Coronary Drug Project Research Group, 1980). The pill did nothing, so taking it reliably was telling you something about the people. Check-in completion might work the same way, reflecting stability like a working phone, housing or a predictable schedule as much as anything the check-in itself does. Where small changes have been shown to improve pretrial outcomes, the change itself was what got tested. Redesigned court summons forms and text message reminders cut failures to appear in field studies in New York City (Fishbane, Ouss, & Shah, 2020). This paper documents the indicator. Whether acting on it changes outcomes is a question for another study.
4. Methods
4.1 Data source and population
All figures come from RePath's supervision analytics views in Snowflake, the data warehouse that holds RePath case, compliance and closure records. The warehouse is refreshed from RePath on a rolling basis, with a lag of one to three days depending on the data source (John Rosenbaum, RePath engineering, October 14, 2026). The figures in this paper come from the warehouse as it stood on October 14, 2026, when closures ran through October 9, 2026, daily check-in records through October 10, 2026, and issue records through September 27, 2026. That means closures through the end of the study window, September 30, 2026, were substantially complete when we pulled the data. The study population is every Missouri case with agency type PreTrial that closed between October 1, 2025, and September 30, 2026, with an outcome of Successful or Unsuccessful, and that was open at least 30 days. That gives 4,833 closures (3,740 successful, 1,093 unsuccessful) across 65 agencies. Agencies varied a lot in size (median 8 labeled closures; mean 74). The five largest supplied 68.8% of closures and the largest supplied 26.8%. We don't name agencies in this paper.
Closures with other outcomes were left out of the rates and are reported separately: Neutral 930 (almost all transfers), Administrative 136 (court discharge) and Unknown 4, which is 1,070 in all and 5,903 closures across every category. Each closure is one supervision episode, and no episode shows up twice. Test, demonstration and training agencies are excluded by the view definitions, and a scan of agency names didn't turn up any.
Queries were written and run through the warehouse's own analysis agent (Snowflake Intelligence) against curated views. The agent ran under automatic model selection, which RePath engineering identified on October 15, 2026, as Claude Opus 4.8. It wrote and ran its own SQL from plain language prompts, C. Johnston reviewed that SQL, and every prompt, answer and query was saved with its date. Only aggregate tables came back. In outcome tables, any subgroup (such as a completion band) with fewer than 11 cases was suppressed or merged with the band next to it. When we ran the analysis, the warehouse's own data quality layer hadn't been built yet (RePath engineering, October 14, 2026). Section 4.4 and Section 7 describe the controls we used instead. Data and ethics covers how AI tools were used in the analysis, and Section 4.4 covers how the figures were reproduced.
4.2 The measure: check-in completion in the first month
What a check-in is. Check-ins are set up in RePath the way the supervising agency directs. The participant gets check-in alerts at random times. Each alert asks the participant to open the RePath mobile app and take a selfie, and the system uses facial recognition to confirm who they are and reports the result to the officer or supervisor. Check-ins take no officer time to run and only take the participant a few seconds. A check-in isn't a meeting with an officer.
First month completion. For each case, completion in the first month is the number of check-ins completed divided by the number scheduled, added up over days 0 to 29 from the start of the supervision episode. About 98% of completed check-ins are passed check-ins, where the system confirmed the participant's identity. Failed check-ins are 0.35% of those scheduled, so how we count them barely changes any figure. A day with no scheduled check-ins is stored as empty, never as zero or as complete. Cases with no scheduled check-ins in the window don't have a completion value. They're reported in their own row and kept out of every mean, gap, rate and AUC.
Whether check-ins get scheduled depends almost entirely on supervision level. Using the level stored on each case, 96% of high level cases, 87% of medium level cases and 2.7% of low level cases had check-ins scheduled in the first month. The volume is very different too. Successful high level cases averaged 188.5 scheduled check-ins in the first 30 days, and successful low level cases averaged 3.1. Of the 1,504 cases that had the measure, 1,299 were high level, 115 medium and 90 low. Supervision level is the level stored on the case when we pulled the data. The views don't keep the level at intake or at day 30, and about 3% of location tracked Missouri cases (medium and high level, all supervision types) changed level during supervision. We report level as context only, and no claim in this paper depends on it.
4.3 The outcome: unsuccessful closure as recorded by the agency
The outcome is the closure category agency staff recorded, Successful or Unsuccessful. Of the 1,093 unsuccessful closures, 506 (46.3%) have the reason BackToJail, 503 (46.0%) RevocationTechnical, 15 (1.4%) RevocationNewCrime and 69 (6.3%) no reason. The first two look like the same ending recorded under different labels before and after a June 2026 change in the closure workflow. As one falls month to month the other rises, and the data owners hadn't confirmed the change when we wrote this. The Missouri pretrial data have no closure reason for absconding, failure to appear or a warrant, so for most of the year new arrests, failures to appear and technical violations can't be separated. Closure outcomes, reasons and dates are entered by agency staff and weren't independently checked for this study. RePath engineering's working assumption is that the officer controls close_date. In these data, check-ins kept being scheduled right up to the recorded close date for 92 to 95% of cases (§5.7), which suggests the recorded date is, for practical purposes, when supervision stopped in RePath.
4.4 Analysis
Headline comparison. We compared mean completion in the first month for successful and unsuccessful closures, with standard deviations, the difference in percentage points with its 95% confidence interval, and Cohen's d. We repeated the comparison using three ways of calculating month one completion from the stored compliance data. The first is the locked definition, completed check-ins added up over the 30 days divided by scheduled check-ins added up over the 30 days. The second is the average of the daily completion ratios across days with check-ins scheduled, and the third is the average of the stored weekly completion ratios across weeks in the window.
Rate result. We compared the unsuccessful closure rate for participants who completed fewer than half of their first month check-ins with the rate for those who completed half or more, with the risk ratio and its 95% confidence interval, at minimum case lengths of 30 and 90 days.
Completion bands. We counted cases and unsuccessful closure rates across 12 completion bands, with exactly 0% and exactly 100% as their own bands.
Discrimination. We computed the area under the ROC curve (AUC) from the band table, counting ties within a band as half, which slightly understates the AUC. The 95% interval is a bootstrap interval from 20,000 resamples of the band counts. We repeated the same calculation for high level cases alone.
Robustness. We recalculated the gap at minimum case lengths of 30, 60, 90 and 180 days, in later 30 day windows and in the last 30 days before closure, inside agencies big enough to test, without the largest agency and without the three largest, with excluded closures recoded as successful and as unsuccessful, and within supervision level.
Agency batch closing and recording lag. Agencies sometimes close a lot of cases on one day. We defined a batch day, per agency, as a day with at least 10 closures or at least five times that agency's median nonzero daily count, and recalculated the headline without closures from batch days. We measured recording lag two ways. The first is the number of days from the last daily record with a scheduled check-in to the recorded close date, which shows whether a closure was entered long after supervision stopped. The second is the number of days from the last completed check-in to the close date, which reflects what the participant did, not how the closure was recorded. We recalculated the headline without closures where scheduling had stopped more than 30 days before the recorded close.
Reproduction. Five independently written queries produced the headline figures and three produced the band split, and they all agreed down to the case. Because the warehouse refreshes on a rolling basis, rerunning the saved queries on a later state of the warehouse is another check, since any difference would come from the data and not the query. We'll rerun the saved queries on a later state of the warehouse and report any differences in a revision. The SQL for every table is saved and dated next to its output in the study's data folder.
4.5 The statistics in plain language
A gap in percentage points is the difference between the two groups' average completion. Cohen's d puts that gap in standard deviation units. By convention 0.2 is small, 0.5 medium and 0.8 large. A risk ratio of 2.31 means the unsuccessful closure rate in one group is 2.31 times the rate in the other. The AUC is about pairs. Pick one case that closed successfully and one that closed unsuccessfully at random, and the AUC is the chance that the successful case completed more of its first month check-ins. An AUC of .50 is a coin flip and 1.0 is perfect separation. The AUC doesn't depend on how common unsuccessful closures are, which is why it's the usual way to compare risk tools across jurisdictions. A d of about 0.7 lines up with an AUC of about .69 (Rice & Harris, 2005).
5. Results
5.1 Headline: the gap in the first month
Participants whose cases closed successfully had completed 68.9% of their scheduled check-ins in the first month, and those whose cases closed unsuccessfully had completed 47.3% (Table 1). That 21.6 point gap is the headline result. In standard deviation terms it's a moderate to large difference (d = 0.67). The three ways of calculating month one completion in §4.4 give almost the same means. For successful closures they're 68.9%, 69.0% and 70.4%, and for unsuccessful closures 47.3%, 47.5% and 47.9%, under the locked sum ratio, the average daily ratio and the average weekly ratio respectively. Which ratio you use doesn't change the result.
Table 1. Check-in completion in the first month by closure outcome. Missouri pretrial cases with check-ins scheduled in days 0 to 29, open at least 30 days.
| Closure outcome | Cases | Mean completion | SD (points) |
|---|---|---|---|
| Successful | 1,212 | 68.9% | 31.5 |
| Unsuccessful | 292 | 47.3% | 35.1 |
| Gap | 21.6 points (95% CI 17.2 to 26.0) | d = 0.67 |
5.2 Unsuccessful closure by completion level
Overall the pattern goes one way (Table 2 and Figure 1). The unsuccessful closure rate is 39.5% for participants who completed none of their first month check-ins and between about 20% and 40% in the bands below 50%. It's 21% to 26% in the middle bands, drops to 13.3% at 80 to 89% and 7.9% at 90 to 99%, and is zero for the 26 participants who completed every check-in. It isn't a perfectly smooth decline. The 10 to 20% and 20 to 30% bands, each with fewer than 50 cases, sit close to the zero band, and the 50 to 60% band sits a little above the bands on either side. High level cases on their own, 86% of the cases with data, show the same shape, with 44.0% at zero, 7.6% at 90 to 99% and none of 24 at 100%. Participants with no check-ins scheduled, mostly low level cases outside the measure, closed unsuccessfully at 24.1%, compared with 19.4% for cases with check-ins. Agencies decide who gets scheduled check-ins, and that decision follows supervision level, so we don't draw any conclusion from that difference.
Table 2. Unsuccessful closure rate by check-in completion in the first month.
| Completion in the first month | Cases | Closed unsuccessfully | Rate |
|---|---|---|---|
| Exactly 0% | 172 | 68 | 39.5% |
| >0 to 10% | 39 | 8 | 20.5% |
| 10 to 20% | 36 | 13 | 36.1% |
| 20 to 30% | 46 | 18 | 39.1% |
| 30 to 40% | 48 | 14 | 29.2% |
| 40 to 50% | 75 | 16 | 21.3% |
| 50 to 60% | 90 | 23 | 25.6% |
| 60 to 70% | 123 | 27 | 22.0% |
| 70 to 80% | 188 | 40 | 21.3% |
| 80 to 90% | 241 | 32 | 13.3% |
| 90 to <100% | 420 | 33 | 7.9% |
| Exactly 100% | 26 | 0 | 0.0% |
| All cases with check-ins | 1,504 | 292 | 19.4% |
| No check-ins scheduled | 3,329 | 801 | 24.1% |
| All labeled closures | 4,833 | 1,093 | 22.6% |
5.3 How well completion separates outcomes
Check-in completion in the first month separated successful from unsuccessful closures with an AUC of .69 (95% CI .66 to .72). That's within the range reported for validated pretrial risk tools (PSA .55 to .68; PTRA .67 to .73), though the populations, outcomes and timing aren't the same (Figure 2 and Table 3). The risk tools rank people across the whole range of risk, which makes a high AUC easier to get. This measure ranks people mostly inside one supervision level, the high level, where cases are more alike than they are across a risk tool's full range. The risk tools are scored before release and have to anticipate failures from the first day, while this measure is taken at day 30 and only covers cases that made it that far. The outcome is different too. Here it's unsuccessful closure as the agency records it, most often a return to jail or a technical revocation, which isn't the same target as failure to appear or new arrest. And the measure needs no extra assessment, interview or scoring, because it comes out of supervision that's already happening.
Among high level cases alone (n = 1,299), the banded AUC is also .69 (bootstrap 95% interval .65 to .73), so mixing supervision levels doesn't explain the result. Leaving out participants who completed nothing, the AUC is .67 (95% CI .63 to .70). A simple flag for completing under half, which is a single cut, has an AUC of .62. It flags 416 of the 1,504 cases (27.7%) and catches 137 of the 292 unsuccessful closures (46.9%), with a specificity of 77.0% (933 of 1,212 successful closures not flagged).
Table 3. Reported discrimination of first month check-in completion and of two validated pretrial risk tools. Not a direct comparison.
| Measure | AUC | Measured on | Predicts | When |
|---|---|---|---|---|
| Check-in completion in the first month (this study) | .69 (.66 to .72) | 1,504 Missouri pretrial cases with check-ins scheduled; mostly high level | Unsuccessful closure as recorded by the agency | Day 30 |
| Public Safety Assessment | .55 to .68 by scale and site | Released defendants in each validation site | Failure to appear; new criminal activity; new violent criminal activity | At booking |
| Federal Pretrial Risk Assessment (PTRA) | .67 / .68 / .71 / .73 | 85,369 released federal defendants | Failure to appear / new arrest / any adverse event / revocation | At intake |
5.4 The rate for completing under half
For cases open at least 30 days, 32.9% of participants who completed fewer than half of their first month check-ins closed unsuccessfully (137 of 416), compared with 14.2% of those who completed half or more (155 of 1,088), a risk ratio of 2.31 (95% CI 1.89 to 2.82). For cases open at least 90 days, the figures are 30.5% (n = 354) and 14.8% (n = 922), a risk ratio of 2.07 (1.66 to 2.58).
5.5 Participants who completed nothing
One hundred seventy two participants completed none of their first month check-ins. They make up 23.3% of unsuccessful closures and 8.6% of successful ones, so they account for a big share of the headline gap. Without them the gap is 13.7 points (75.3% vs. 61.6%; n = 1,108 and 224), the AUC is .67, and the unsuccessful closure rate still falls across merged bands, from 32.2% (above 0 to 30%) to 24.4%, 23.5%, 16.8% and 7.4% (90 to 100%). So an early zero carries one of the highest unsuccessful closure rates in the data, and among participants who were using the app, how much of the first month they completed still separates outcomes.
5.6 Robustness
The gap only shrinks a little as the minimum case length goes up, from 21.6 points at 30 days to 18.1 for cases open six months or more (Table 4). So it isn't coming from short cases, where the first month is most of the case. Both groups complete fewer check-ins as cases go on, and unsuccessful cases drop off faster. The gap in the first month is the smallest of the four windows, and it's there from the start.
Table 4. Gap in the first month by minimum case length, and the gap in later windows. Completion in percent; gaps are computed from unrounded means.
| Cut | Successful | Unsuccessful | Gap (points) | Cases (succ. / unsucc.) |
|---|---|---|---|---|
| Open 30+ days (headline) | 68.9 | 47.3 | 21.6 | 1,212 / 292 |
| Open 60+ days | 68.8 | 48.1 | 20.7 | 1,115 / 265 |
| Open 90+ days | 68.3 | 48.6 | 19.7 | 1,032 / 244 |
| Open 180+ days | 67.9 | 49.8 | 18.1 | 798 / 176 |
| Days 30 to 59 (open 60+) | 66.3 | 42.6 | 23.6 | 1,101 / 263 |
| Days 60 to 89 (open 90+) | 62.0 | 36.1 | 25.9 | 1,017 / 243 |
| Last 30 days before closure | 44.8 | 15.2 | 29.6 | 1,189 / 279 |
Inside agencies. Nine agencies had at least 11 cases with data for each outcome, and all nine show a positive gap (18.4 points weighted by cases; 21.5 unweighted). Without the largest agency the pooled gap is 19.9 points (n = 1,322), and without the three largest it's 19.9 (n = 1,263).
Excluded closures. Recoding all 1,070 neutral, administrative and unknown closures as unsuccessful gives a gap of 19.5 points, and recoding them as successful gives 18.3. Their completion (about 52%) falls between the two labeled means, which is why the gap barely moves. None of the excluded reasons is an absconding or failure to appear code, so those endings aren't hiding in the excluded group. At most, the four Unknown closures are unclear.
By supervision level (context). The gap is 21.0 points for high (n = 1,299), 19.6 for medium (n = 115) and 12.8 for low (n = 90; indicative only). Weighting the gaps for each level by cases gives 20.4 points, compared with the pooled 21.6.
5.7 Agency batch closing and recording lag
Agencies sometimes close a lot of cases on one day, and closure outcomes and dates are whatever the agencies provided, on their own schedules. We ran two checks to see whether that recording behavior, and not what participants did, produces the headline.
Agency batch closing. Batch closing does happen in these data. Using the definition in §4.4, 25.5% of all Missouri pretrial closures in the window fell on 117 batch day events across 23 of the 65 agencies. They leaned toward transfers (35.8% of neutral closures) and unsuccessful closures (28.0%) over successful ones (21.7%). Dropping closures from batch days lowers the headline gap from 21.6 to 18.4 points (70.8% vs. 52.4%; n = 1,010 and 222), because bulk closing days carry more than their share of unsuccessful cases with low completion. The gap stays large and positive without them, so batching changes the size of the result but doesn't explain it.
Recording lag. Check-ins kept being scheduled right up to the recorded close date for 92 to 95% of cases. The median gap from the last scheduled check-in to the close date was zero days, the 90th percentile was one day, and 5 to 8% of cases were beyond 30 days. Agencies keep scheduling until they close the case in RePath, so the recorded close date is, for practical purposes, when supervision stopped in the system, and closures entered long after supervision ended are at most that 5 to 8% tail. Taking those cases out moves the headline from 21.6 to 21.5 points.
This paper reports one pooled estimate over the 12 months of closures. The gap was positive in every quarter of the year, with and without the exclusions above, and the full year figure is the one we use from here on (§7).
5.8 What the outcome contains
Almost every unsuccessful closure was recorded as a return to jail or a technical revocation (§4.3). Officers get alerts about check-in problems. In days 0 to 29, RePath raised 2,281 FailedCheckIn issues on 693 of the 4,833 cases (14.3%). Separately, 1,198 cases (24.8%) had at least one missed check-in. The data don't record which check-in outcome raised each issue. All 1,198 are among the 1,504 cases with check-ins scheduled, since a check-in has to be scheduled before it can be missed. "Missed" is one of several recorded outcomes for a check-in, along with passed, failed, overridden and pending, so a case can fall short of full completion without a missed check-in. Of the 1,504 cases, 1,478 didn't complete every check-in in the first month, and 1,198 had at least one marked missed. Issues are alerts for officers to review. Nothing in the data ties an issue to a sanction or to a closure reason, so the data neither show nor rule out missed check-ins playing a part in technical revocations. In RePath's experience rolling out the product, a missed check-in on its own doesn't lead to a violation. That's context from practice, not a finding of this study.
5.9 The end of the case (reference only)
In the last 30 days before closure, most unsuccessful cases had more or less stopped checking in. They averaged 15.2% completion (n = 279), and 64.2% completed none, compared with 44.8% and 30.1% for successful cases (n = 1,189). The lag from the last completed check-in to the recorded close date shows the same thing. The median was 3 days for successful cases and 56 days for unsuccessful ones, with 29.1% and 58.7% respectively beyond 30 days. People do pull back before an unsuccessful closure, and that's behavior, not a quirk of recording, since scheduling continued to the close date in both groups (§5.7). For most cases the first month measure is taken long before that point, and 974 of the 1,504 cases with data ran six months or more. Along with §5.5, this suggests the signal in the first month isn't just the end of the case showing up early. We report the figures from the end of the case as a reference point, not as a predictor. Dropping cases based on how they behaved after month one would remove exactly the cases an early indicator is supposed to flag, so we don't apply any exclusion like that to the headline.
6. Discussion
6.1 What this study shows
In Missouri pretrial supervision, the first month of a participant's check-in record gives an early read on how the case is likely to end. From the fifth week of supervision, completion separates successful from unsuccessful closures by about 22 points overall, and by an average of 18 to 22 points inside agencies and across case lengths. The people who complete the most close unsuccessfully the least. How well it separates outcomes is in the range reported for validated pretrial risk tools, and it uses information RePath already collects, with nothing extra asked of officers or participants.
That goes against what the pretrial research would lead you to expect, since dynamic factors carried little predictive weight there (Bechtel et al., 2011). The difference is probably in what "dynamic" means. The dynamic factors in that research were measured at assessment, while this measure is behavior recorded continuously after release. Goldkamp and White (1998) saw a similar signal in reporting compliance more than 25 years ago. Remote check-ins make it visible at scale and close to real time.
6.2 What this study does not show
It doesn't show that check-in completion causes outcomes, that raising completion would improve them, or that any particular response to low completion helps. Like reliably taking a placebo, completion might reflect stability more than it creates it (§3.3). It doesn't separate new arrests and failures to appear from technical revocations, because most unsuccessful closures are recorded as BackToJail or RevocationTechnical, and those can't be told apart by cause. It doesn't cover participants who aren't scheduled check-ins. It also doesn't show that the measure adds information beyond a pretrial risk assessment score, which is still an open question.
6.3 How this fits with risk assessment
This indicator doesn't replace a pretrial risk assessment, and it can't, because it doesn't exist until someone has been released and supervised for a month. It shows up at day 30, when the score from booking is already fixed, and it separates outcomes inside the high supervision level, where most of these cases sit. A risk assessment informs the release decision and the starting conditions. Behavior in the first month can tell an officer which participants, out of those already being supervised, need the most attention.
6.4 Product implications
We see three next steps. First, show first month completion to officers starting in week five, and flag participants with zero completion first. Someone who has completed nothing has one of the highest unsuccessful closure rates in the data and may be dealing with a practical problem like a phone or app issue. Second, give the indicator to officers in a consistent form and, where agencies choose to, to others like judges, and leave the response to the agency. Third, keep a history of supervision levels and the response taken, so agencies and RePath can later test whether acting on the indicator changes outcomes.
7. Limitations
- Descriptive and observational. The study shows an association, not a cause. No response to low completion was assigned or tested.
- Data as entered by agencies. Closure outcomes, reasons and dates are recorded by agency staff on their own schedules, sometimes in batches, and weren't independently checked for this study. Check-ins kept being scheduled up to the recorded close date for 92 to 95% of cases, so the recorded date tracks the end of supervision in RePath for nearly every case, but the data owners haven't confirmed what the field means. The app captures the check-in record, so agencies don't enter it, although officers can override a check-in outcome and agencies decide who gets scheduled check-ins.
- What the outcome is made of. Unsuccessful closures are almost all returns to jail or technical revocations. New arrests and failures to appear can't be separated, and there's no code for absconding or a warrant.
- One estimate for the full year. The paper reports one pooled estimate over 12 months of closures. The gap stayed positive in every quarter of the year, but its size ranged from about 10 to 28 points by closure quarter, and the batch day and recording lag tests didn't explain the variation. Closure outcomes and dates are whatever the agencies provided, and changes in how agencies recorded closures during 2026 may be part of it. The data owners plan to review recording practices once their data quality work is done.
- Agency batch closing. A quarter of closures fall on agency batch days. Without them the headline gap is 18.4 points instead of 21.6. We report both figures.
- Who is covered. Only cases with check-ins scheduled in the first month have the measure, and in practice these are medium and high level cases. The finding says nothing about low level participants who aren't scheduled check-ins.
- Supervision level is the level stored today. No intake or day 30 level is available, and about 3% of location tracked Missouri cases (medium and high level) changed level. Level is a supervision setting, not the output of a risk assessment.
- One state, one year, one platform. The study covers 65 agencies, and the five largest supplied most of the closures. It needs to be repeated in other states and types of supervision.
- A rolling data feed. All figures come from the warehouse as it stood on October 14, 2026. The warehouse runs one to three days behind RePath and refreshes continuously, so a later state may add closures that were recorded late or corrections. We'll rerun the saved queries on a later state and report any difference in a revision.
- No independent data quality layer. When we ran the analysis, the warehouse's own data quality components hadn't been built, and RePath engineering advised that the data shouldn't be treated as final until they are. The controls here are our own: C. Johnston's review of the generated SQL, five independently written headline queries, three definitions of the measure, checks inside agencies and with outcomes recoded, minimum case lengths, and the batch closing and lag tests.
- AUC from banded data. Ties within a band were counted as half, which slightly understates the AUC, and the intervals are bootstrap intervals on the band counts. We plan to compute an exact AUC from the unbanded values in a revision.
- Exploratory origin and conflicts. The analysis started as an exploratory look at the data, not a preregistered study. The definitions, minimum case length and filter were locked before the final tables were run, but independent replication is the real test. RePath Labs designed, funded and analyzed a study of data from its own product.
8. Use of this information
The information in this paper is provided to agencies for their own use, as information that may help them follow up with a participant or order appropriate interventions. Check-in completion in the first month is an indicator of participation in supervision with a documented relationship to outcomes. It isn't an established, validated pretrial risk assessment.
Data and ethics
The data are RePath case, compliance and closure records from Missouri pretrial agencies, used for this research under RePath's existing agency contracts. All analysis ran inside RePath's data warehouse. Only aggregate tables came back. In outcome tables, any subgroup with fewer than 11 cases was suppressed or merged, and no participant level record, identifier, name or date left the warehouse. We don't name agencies. Closure outcomes and dates are as the agencies entered them. The data are current through October 9, 2026, for closures and October 10, 2026, for daily check-in records, as held in the warehouse on October 14, 2026.
Use of AI tools. Snowflake Intelligence, the warehouse's analysis agent, wrote and ran the queries, running Claude Opus 4.8 under automatic model selection, from plain language prompts written by C. Johnston. Every prompt, answer and query was saved with its date. RePath Labs set the filter, definitions and analyses and locked them before the final tables were run (Appendix A). C. Johnston reviewed all of the SQL, along with plain language summaries of the fields and filters each query used, audited the query logic against the saved output tables with AI assistance, checked every reported figure against those tables, and is responsible for the content.
Competing interests and funding
RePath Labs (eHawk Solutions) designed, ran and funded this study, and it develops the supervision software whose data are analyzed here, including the check-in feature. The authors have a commercial interest in the outcome. No outside or public funding supported the work.
Author contributions
Cliff Johnston (RePath Labs) designed and ran the warehouse queries, reviewed the SQL the agent generated, built the verification and robustness analyses, including the batch closing and recording lag tests, and prepared the paper. Ted Green (RePath Labs) reviewed the analysis and set the checks it had to pass before publication, computed the AUC and its confidence interval, and wrote and edited the paper. Both authors approved the final version and are accountable for it.
Acknowledgements
Thanks to John Rosenbaum and Chris Atkinson of the RePath technology team for their help with the data warehouse and its data quality questions.
References
- Advancing Pretrial Policy & Research. (2021). The Public Safety Assessment (Pretrial Research Summary, revised April 2021). Center for Effective Public Policy. https://www.advancingpretrial.org/wp-content/uploads/2025/09/PSA_Research_Summary_2021April.pdf
- Bechtel, K., Lowenkamp, C. T., & Holsinger, A. (2011). Identifying the predictors of pretrial failure: A meta-analysis. Federal Probation, 75(2), 78–87.
- Cohen, T. H., Lowenkamp, C. T., & Hicks, W. E. (2018). Revalidating the federal Pretrial Risk Assessment Instrument (PTRA): A research summary. Federal Probation, 82(2).
- Cohen, T. H., Lowenkamp, C. T., & VanBenschoten, S. W. (2016). Does change in risk matter? Examining whether changes in offender risk characteristics influence recidivism outcomes. Criminology & Public Policy, 15(2), 263–296. DOI: 10.1111/1745-9133.12190.
- Coronary Drug Project Research Group. (1980). Influence of adherence to treatment and response of cholesterol on mortality in the Coronary Drug Project. New England Journal of Medicine, 303(18), 1038–1041.
- Council of State Governments Justice Center. (2019). Confined and costly: How supervision violations are filling prisons and burdening budgets. https://csgjusticecenter.org/wp-content/uploads/2020/01/confined-and-costly.pdf
- Durose, M. R., & Antenangeli, L. (2023). Arrest history of persons admitted to state prison in 2009 and 2014 (NCJ 305022). Bureau of Justice Statistics. https://bjs.ojp.gov/document/ahpasp0914.pdf
- Fishbane, A., Ouss, A., & Shah, A. K. (2020). Behavioral nudges reduce failure to appear for court. Science, 370(6517), eabb6591. DOI: 10.1126/science.abb6591.
- Freeman, K., & Donnelly, N. (2005). Early-phase predictors of subsequent program compliance and offending among NSW Adult Drug Court participants (Crime and Justice Bulletin No. 88). NSW Bureau of Crime Statistics and Research.
- Goldkamp, J. S., & White, M. D. (1998). Restoring accountability in pretrial release: The Philadelphia pretrial release supervision experiments, final report (NCJ 189164). Crime and Justice Research Institute. NIJ Grant 96-IJ-CX-0008.
- Reaves, B. A. (2013). Felony defendants in large urban counties, 2009: Statistical tables (NCJ 243777). Bureau of Justice Statistics. https://bjs.ojp.gov/content/pub/pdf/fdluc09.pdf
- Rice, M. E., & Harris, G. T. (2005). Comparing effect sizes in follow-up studies: ROC area, Cohen's d, and r. Law and Human Behavior, 29(5), 615–620. DOI: 10.1007/s10979-005-6832-7.
- Zettler, H. R., & Martin, K. D. (2022). Technical violations and their effects on pretrial/bond supervision outcomes. Criminal Justice and Behavior, 49(12), 1763–1778. DOI: 10.1177/00938548221104021.
Appendix A: Locked filter and definitions
Every table in this paper uses the filter and definitions below, and they were locked before the final tables were run.
| Element | Definition |
|---|---|
| Source views | V_CASE_CLOSURES (closures and outcomes); V_COMPLIANCE_SNAPSHOT (daily scheduled and completed check-ins); V_CASELOAD (stored supervision level); V_ISSUES (FailedCheckIn issues). |
| Warehouse state | Figures taken on October 14, 2026. Latest close_date October 9, 2026; latest daily record October 10, 2026; latest issue September 27, 2026. The warehouse runs one to three days behind RePath. |
| Population filter | root_agency_name '(MO) Missouri'; agency_type 'PreTrial'; close_date from October 1, 2025, to September 30, 2026, inclusive; closure_outcome_category in (Successful, Unsuccessful); DATEDIFF(day, episode_start, close_date) ≥ 30. One row per episode (caseid + episode_start). |
| Result of the filter | 4,833 labeled closures (3,740 successful, 1,093 unsuccessful). Reported separately: Neutral 930, Administrative 136, Unknown 4 (1,070; 5,903 closures in all). No episode appears twice. Test, demonstration and training agencies are excluded by the view definitions. |
| First month completion | Per episode, SUM(completed_checkins) ÷ SUM(scheduled_checkins) over daily rows with DATEDIFF(day, episode_start, period_start) between 0 and 29. A day with nothing scheduled stores NULL. Cases with zero scheduled or no rows go in their own row with no data, and are left out of every mean, SD, gap, rate and AUC. |
| Other definitions | Average of daily completion ratios over days with scheduled check-ins; average of stored weekly checkin_success_ratio over weeks in days 0 to 29. Reported in §5.1 only. |
| Supervision level | Stored risk_level on V_CASELOAD scoped to Missouri, joined by caseid. Context only. |
| Gap | Successful mean minus unsuccessful mean, in percentage points. The gap weighted by level is the gap within each level, weighted by cases with data. |
| Batch day | Per agency, a day with closures ≥ LEAST(10, 5 × that agency's median nonzero daily closure count); all closure categories; no minimum case length. |
| Recording lag | Days from the last daily record with scheduled_checkins > 0 to close_date. A closure counts as recorded late when this is more than 30 days or no check-in was ever scheduled. Behavioral lag = days from the last daily record with completed_checkins > 0 to close_date (§5.9, reference only). |
| Disclosure control | Aggregates only. In outcome tables, subgroups under 11 cases are suppressed or merged with the band next to them. No participant level row, identifier, name or date was returned or saved. |
| Exceptions | The figure for level changes (§4.2) covers all location tracked Missouri cases, not only this population. FailedCheckIn issues (§5.8) come from the issues view, limited to the same 4,833 closures. |